
How far are we from the 100$ Phenome?
A review of the investment into plant phenotyping over the last 10 years
There can be no question about the fact that phenotyping is en vogue! Plant breeders and scientists around the world know that by automatically screening their genetic material or by automating their experimental setups, they can increase the objectivity, resolution (spatial or temporal), and throughput of their measurements, while reducing their labor input—but what about cost?
The big question, next to “What can I do with automated plant phenotyping?”, is “How expensive is it?” And to that, there are no easy answers!
Whereas scientists and breeders might try to answer the first one by themselves, the second requires more digging because it depends on many factors, like the degree of automation, throughput, size, the number of sensors, the particular data storage solution, etc. At the same time, it also depends strongly on the market for phenotyping instruments and the suppliers in that market.
Until now, only the biggest companies and well-funded institutes could afford to purchase and operate large-scale phenotyping platforms. However, it’s perhaps obvious that smaller research groups would benefit just the same. For instance, smaller research groups might use phenomic information to push forward research activities and product pipelines. Therefore, what is the actual price of such a platform, and how close are we to the 100€ phenome?
In this blog, I want to tackle this question by analyzing what has happened in the market over the last 10 years. Of course, our discussion cannot lead you to an actual price for the particular setup you have in mind, but by looking at how money is being invested into this technology, you will get a sense for where the price is going. So, let´s go back and look at the recent phenotyping history…
The first decade of automated plant phenotyping
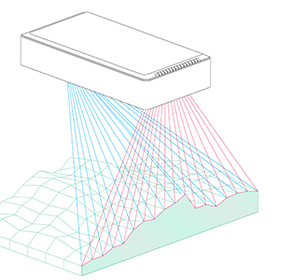
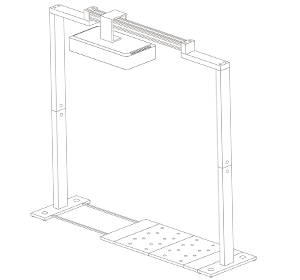
The era of large scale phenotyping systems started in the early 2000’s with the development of the first automated phenotyping system by CropDesign. CropDesign used conveyors and an RGB camera to assess the mostly morphological traits of hundreds of rice plants automatically. The system was the first to allow for high-throughput analysis of the effects of genes on plant performance under different environmental conditions. In 2006, CropDesign was acquired by BASF, and the trait discovery technology was incorporated into their breeding and chemical pipelines.
In 2005, LemaTec copied that platform in cooperation with another plant breeder and commercialized it successfully. The phenotyping market was born, and it was a lonely market dominated by one company. In the following 5 years, many universities and plant breeding and protection companies acquired such systems.
From 2010 on new suppliers appeared on the market providing similar commercial conveyor belt solutions, but now with different screening concepts like the “sensor-to-plant” concept from dedicated sensor suppliers. Even today, the young phenotyping market is still not well defined, and new trends, concepts, and sensors are being developed and validated all the time. It is still too early to say what standard methods for plant phenotyping should be, but they are urgently needed nonetheless.
From that history, let us now look at the status quo for pricing in plant phenotyping.
How did we survey the status quo?
We wanted to evaluate whether phenotyping is on the way becoming an established technology or whether it would continue to be a luxury that only large scale companies can afford. To do so, we evaluated 44 commercial systems that were installed by different suppliers over the last 10 years. We queried public sources and project leaders from around the world with the goal of covering at least 75% of existing commercial systems.
The systems we included in the survey had to fulfill the following criteria:
- Scan full plants (not leaf disks or single organs)
- Plants had to grow in pots, trays, or plots
- Run fully automatically
- Have at least a capacity of 30 statistical units (pots, trays, plots)
- Built by a commercial supplier, not a self-built solution
We anonymously evaluated the following parameters:
- Price (for the whole system incl. installation in full K€)
- Capacity (in statistical units, e.g., # of pots, trays, or plots)
- Supplier (Categories A – E)
- Throughput (time to scan all statistical units with all sensors)
- Number of sensors (different data sources, not necessarily the number of cameras, e.g., a 3D system with a stereo camera would have 1 sensor, although it might use 2 or more cameras to acquire the data)
- Year of installation
For simplicity and to ensure that we had quantitative values, we did not cover aspects such as data quality or scientific results (like number of publications) achieved since the installation of the platforms.
Another important aspect to consider are of course the operational costs, which are often underestimated, like labor costs for technicians to setup and conduct experiments, pot filling, sowing, harvesting, maintenance etc. etc, those costs are not considered in this survey, but should definitely be taken into consideration when you plan such a platform.
In a later section of this article, we will evaluate the price per plant. To see how we calculated this see Appendix A.
Where are we today in digital plant phenotyping?
Before looking at the development of costs per system, let us review the market itself. After 10 years of using digital high-throughput platforms, the market matured, gaining valuable experience and insight through what were sometimes hard lessons. Often, some of the early concepts had to be reexamined and redesigned. Phenotyping is frequently still thought of as a tool for that needs R&D by itself, rather than a tool for solving scientific questions, but little by little we are getting closer to where we want to be (link to blog).
But where are we from a whole market perspective? Is phenotyping all hype, or will it become an established method in plant breeding and research. Perhaps it needs only a push to evolve to the next stage.
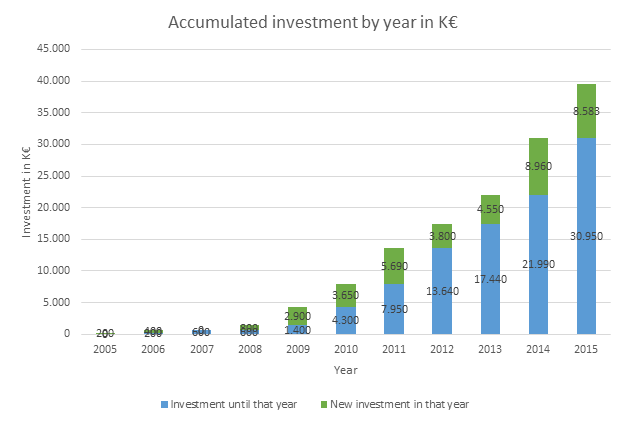
Looking at the number of installed phenotyping systems over the last ten years, we can see from our survey a clearly increasing pattern—one that is exponential, in fact. Almost every year, there were more large-scale systems installed than in the previous year.
Looking at market theory, we could argue that this first phase of growth matches perfectly the technology adoption lifecycle. First, the early and enthusiastic innovators installed their systems between 2005 and 2009. Then, the early adopters were able to profit from the experience gained and establish more phenotyping systems with new ideas, concepts, and technologies from 2010 until today.
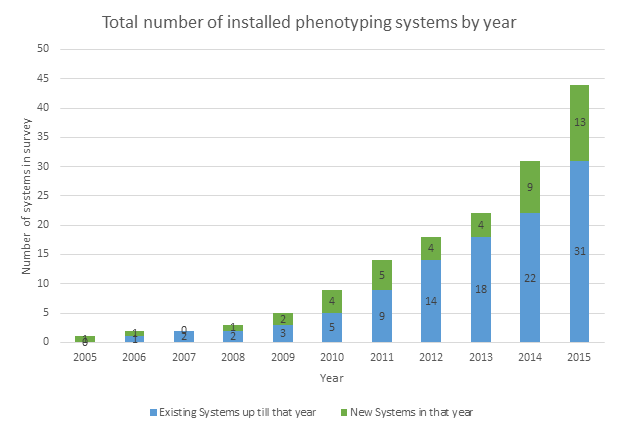
Based on this insight, we could argue that we will soon enter the early majority phase of the technology adoption lifecycle, with more suppliers offering cheaper systems that will in turn allow more users to afford digital phenotyping. Looking at the total investment over the last ten years as well as the number of new investments per year, we can see that this trend is already happening. While the number of systems is growing exponentially, the total investment per year is growing slower, resulting in a lower average price per system in 2015 than 5 years before.
The 44 systems we observed had a total investment value of almost 40 Mio €. As this is only a fraction of the total investment into phenotyping in the last decade, we can look forward and try to answer the question: How much should phenotyping presently cost?
Where will prices go?
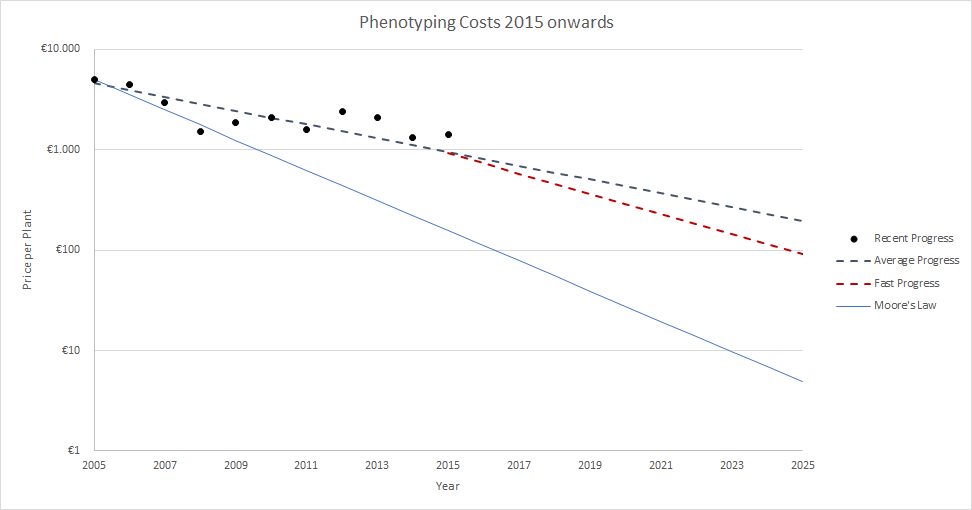
If we look at the development of the average price per plant over the last 10 years, we notice two important things:
- The average price per plant is generally decreasing.
- With increasing competition and more available technology, we see a much wider range of average prices than we saw only 5 years ago.
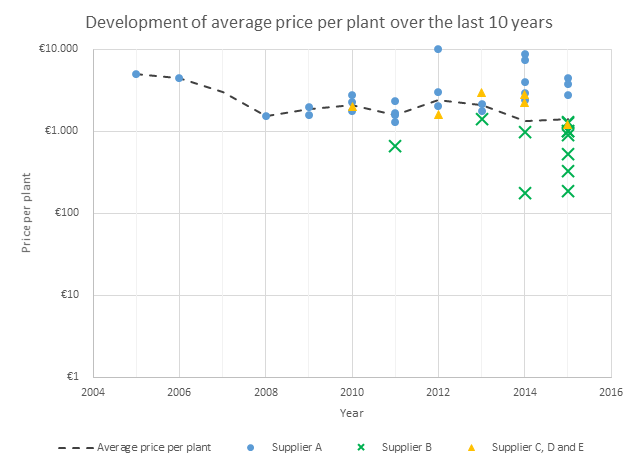
Looking at the extreme cases, we can see large scale phenotyping platforms with only a few sensors that have been established for 175€/plant and are still capable of delivering resilient data in very high throughput. At the other extreme are greenhouse conveyor-based, multispectral systems with an average price of more than 4.500€/plant that can only screen plants in detail once per day.
Both systems have their applications, but we believe that, similar to genomics, the costs of such phenotyping platforms should be continuously decreased to satisfy the widest possible range of uses. Often multi-wavelength systems cannot deliver much more information compared to simple morphological measurements. In other cases, the available information is poorly analyzed that an investment in such a system will also require you to ramp up your data analysis pipeline.
Looking at the average in 2015, we can say that a typical price for a medium size phenotyping system would be between 500 – 1.000€ per plant. We can also see that based on current trends, the 100€ phenome could easily become a reality. It will be the responsibility of suppliers and researchers to further develop phenotyping into a mature and established market. Industry should drive the decrease of costs by simplifying and standardizing their technology, while providing excellent quality, so that the application of their products will be easy. Researchers need to validate sensors and methods so that meaningful data will be generated and so that each Euro spent on future systems contributes to the delivery of scientific breakthroughs.
Working like this, we believe that in only a few years we could reach the 100€ phenome, helping digital phenotyping to become an everyday tool in breeding and science.
Appendix A
Calculating the price per plant for a phenotyping system is not easy as there could be many definitions for the price per plant as well as multiple side constraints to account for.
On one hand, it is hard to compare the systems with each other when you look at their throughput and their number of sensors. System with real high throughput (multiple hundred plants per hour) can acquire much more data and even measure daily changes compared to medium throughput systems that need a full working day to screen their capacity of plants. At the same time, multi-spectral systems with multiple sensors might be able to capture additional information. Nevertheless, as the Donald Danforth Center has shown in their study some multispectral sensors offer a great deal of value where others are not directly adding new information. One could argue that each of the systems from our survey was designed and built to fulfill a specific need. Although a faster system might offer more daily data points, it might not help for certain experiments. Therefore, we have decided not to take throughput or number of sensors into account for the price per plant.
On the other hand, the definition itself of the price per plant is critical. We calculated it simply as the buying price of the whole system divided by its capacity. This is of course not reflecting the costs of performing an experiment on such a system, but just the investment you have to consider getting a system with a certain capacity. To a price for the costs per plant in an experiment, we would need to measure the uptime of systems, the cost for maintenance and service, the overall lifetime, and the usage per year. As most of this data is still unknown for phenotyping systems, we could assume an average for all systems. However, by doing so we would only multiply the investment costs per plant by a constant value and therefore receive the same relations of the systems to each other. Therefore we have decided to provide the information in this blog to get a better feeling for prices when investing into large scale phenotyping systems.