
Modeling custom plant traits with HortControl at Bioversity International
With more than 1,500 different types of edible and wild species of banana, Bioversity International is home tothe world’s largest collection of banana germplasm. The organization aims to contribute to the secure long-term conservation of the entire banana gene pool while also conducting research to increase the diversity of cultivars within the banana industry (1). Securing long-term conservation means growing and assessing the entire gene pool on a frequent basis, and this is just one process. Assessing all of these plants is a manual, repetitive, and time-consuming process that requires extensive human labor. A wide range of parameters, such as biomass, leaf area, and growth rates, are traditionally measured by hand, making it very labor intensive to perform frequently across hundreds of genotypes.
Digital and automated plant phenotyping solutions such as PlantEye alleviate many of these challenges, offering high throughput measurement of over 20 parameters of plant growth and morphology. However, the biologists at Bioversity International required measurement of a unique trait to characterize the growth rate of their individual banana genotypes; total biomass. When these unique parameters are not covered by existing digital phenotyping tools, biologists must revert to manual measurements that are often detrimental to plant health, through intrusive or destructive measurements. As a solution, Phenospex introduced a simple machine-learning modeling algorithm within the HortControl software that enables high-throughput, automated, and non-destructive predictions of any plant parameter that fits the requirements of linear regression.
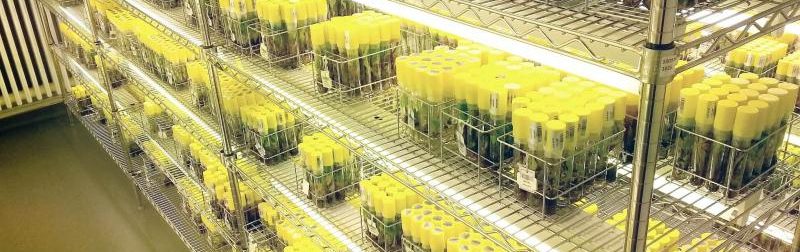
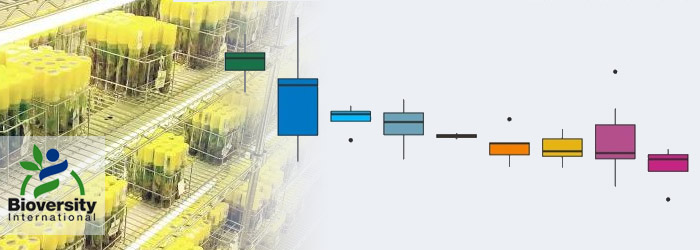
Bioversity International’s extensive banana genotype collection.
The potential of machine learning to enable automated plant phenotyping of unique parameters was highlighted in this application with Bioversity International. The machine learning platform integrated within HortControl empowered the biologists to develop a model capable of inferring plant total biomass from the 3D data captured from PlantEye, without the need for a trained data scientist or machine learning expertise. HortControl made it possible to transform a manual, intrusive measurement into an automated and high-throughput plant phenotyping process. Let’s look in more detail at how this was achieved.
Case Study:
Machine learning enables non-destructive prediction of total biomass
The challenge
Bioversity International’s study and comparison of plant growth rates across genotypes require the measurement of total biomass at multiple time points. This time-consuming and intrusive process traditionally requires uprooting the plant and washing the soil from the roots, weighing and then repotting. The manual nature of this approach is slow, labor-intensive and detrimental to the growth and health of the plant. As establishing the total biomass of a plant requires the measurement of the root mass, it is unattainable to imaging systems like PlantEye that can only see the shoot of the plant.
The solution
Phenospex partnered with Bioversity International to provide an automated total biomass measurement solution that utilized the machine learning capabilities of the HortControl software. The approach aimed to predict total biomass from one or more parameters that the PlantEye system could calculate directly from the 3D spectral scans, such as leaf area and digital biomass.
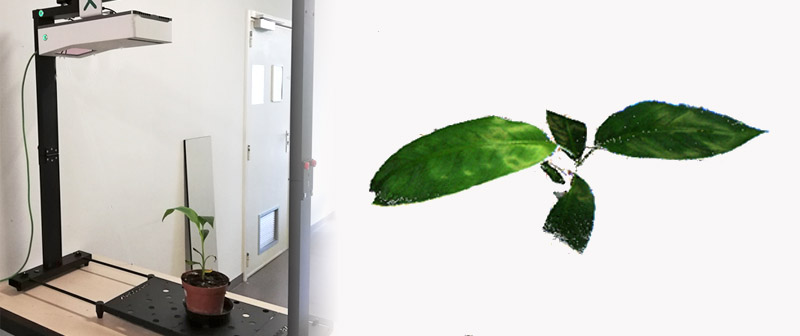
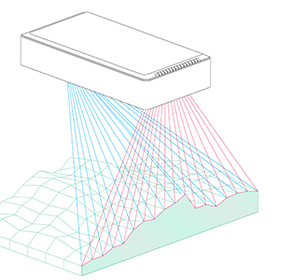
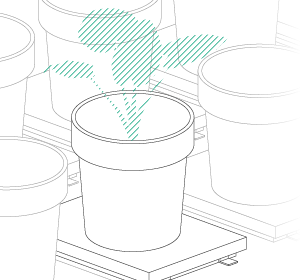
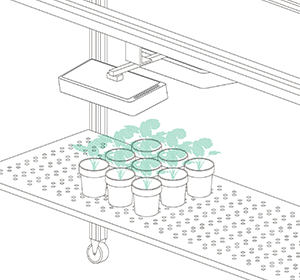
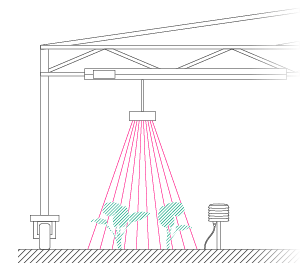
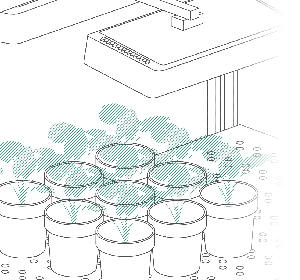
Each plant was scanned with PlantEye F500, in this case in a MicroScan setup, to generate a 3D plant model providing data on 20 plant parameters.
The first step required training the machine learning algorithm on a dataset of crop parameters that could subsequently be used to predict total biomass in future growing seasons. For this training dataset, Biodiversity International chose 500 plants from 15 different genotypes separated in three groups representing three growing seasons. The following workflow was conducted:
- Each plant was scanned with PlantEye, in this case in a MicroScan setup, to generate a 3D plant model providing data on 20 plant parameters. These parameters were used as the inputs (independent variables) for the multivariate regression used to drive the machine learning algorithm.
- For each plant scanned, Bioversity International manually weighed and measured several phenotypic parameters including plant height, leaf area and total biomass.
- Within HortControl, a new machine-learning model was created to correlate the 3D spectral data obtained from PlantEye to the manual measurements taken for each plant. The manual data from the first two growing seasons was input into HortControl, providing a dataset to train the machine learning algorithm on.
After inputting the training dataset, HortControl’s machine learning tool uses linear regression to create a correlation between the manual measurements and the PlantEye data. In this case, an R2 of 0.952 was achieved, meaning that the model is highly precise and explains 95% of the fitted data in the regression model. Critically, the usability of this machine learning tool is achieved through a simple point-and-click graphical interface that requires no specific training in data science or coding, making it widely accessible to biologists.
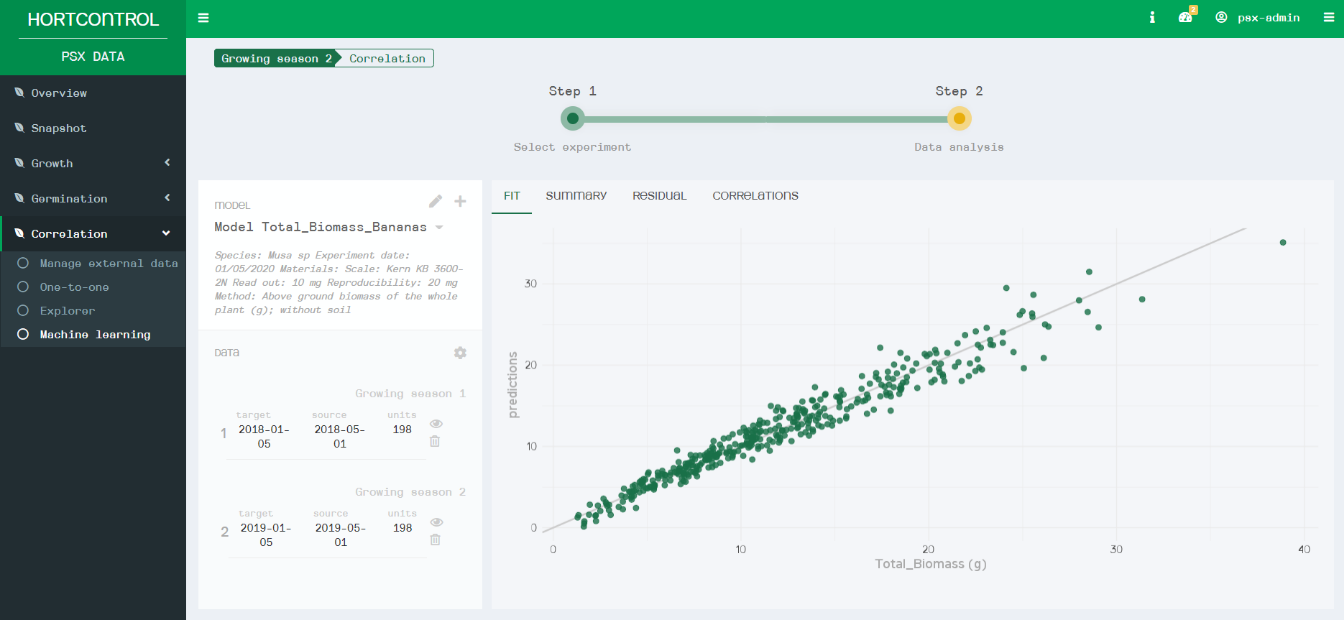
The simple interface of the HortControl software makes machine learning accessible to all. The graph visualizes the fit between the manual measurements (X axis) and the measurements predicted by the model (Y axis).
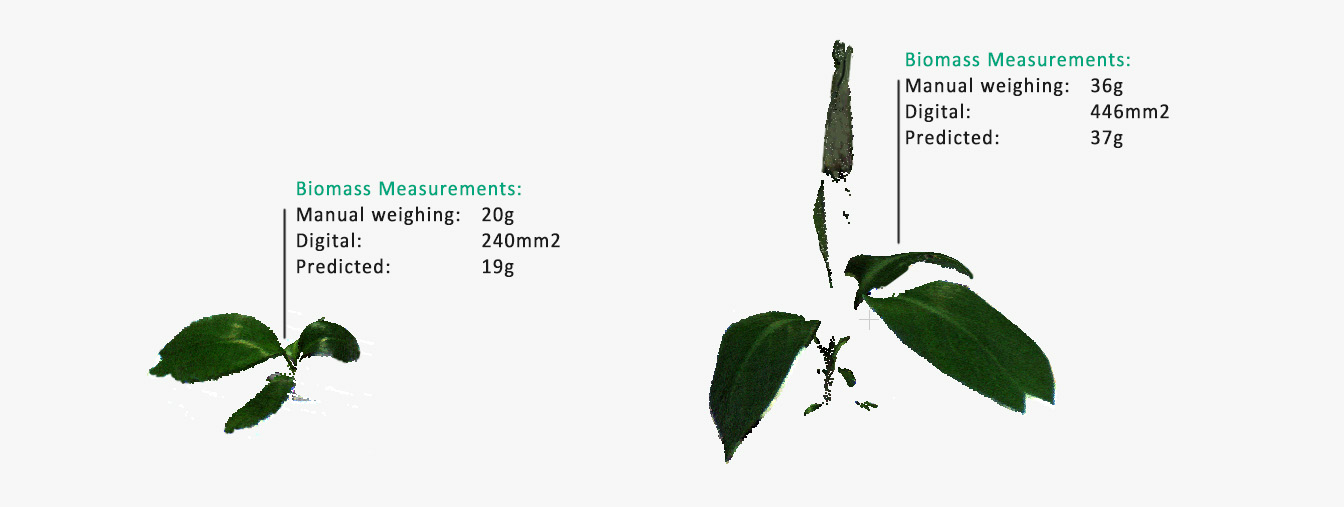
HortControl’s machine learning tool links the training data (manual measurements) with the plant parameters of PlantEye to predict the total biomass of Bioversity International’s banana strains. * The image is for explanation purposes and not a visual of HortControl.
The result
This provided a new ‘Total Biomass’ parameter that could be added to the range of plant phenotype parameters currently measured by PlantEye. In each future growing season, Bioversity International can now estimate total biomass from the 3D spectral data obtained from PlantEye, without any manual and detrimental intrusive measurements. This has led to a fully automated, high-throughput plant phenotyping solution to measure total biomass in real time between genotypes and conditions. The result? Less time measuring, more time for analysis or new research.
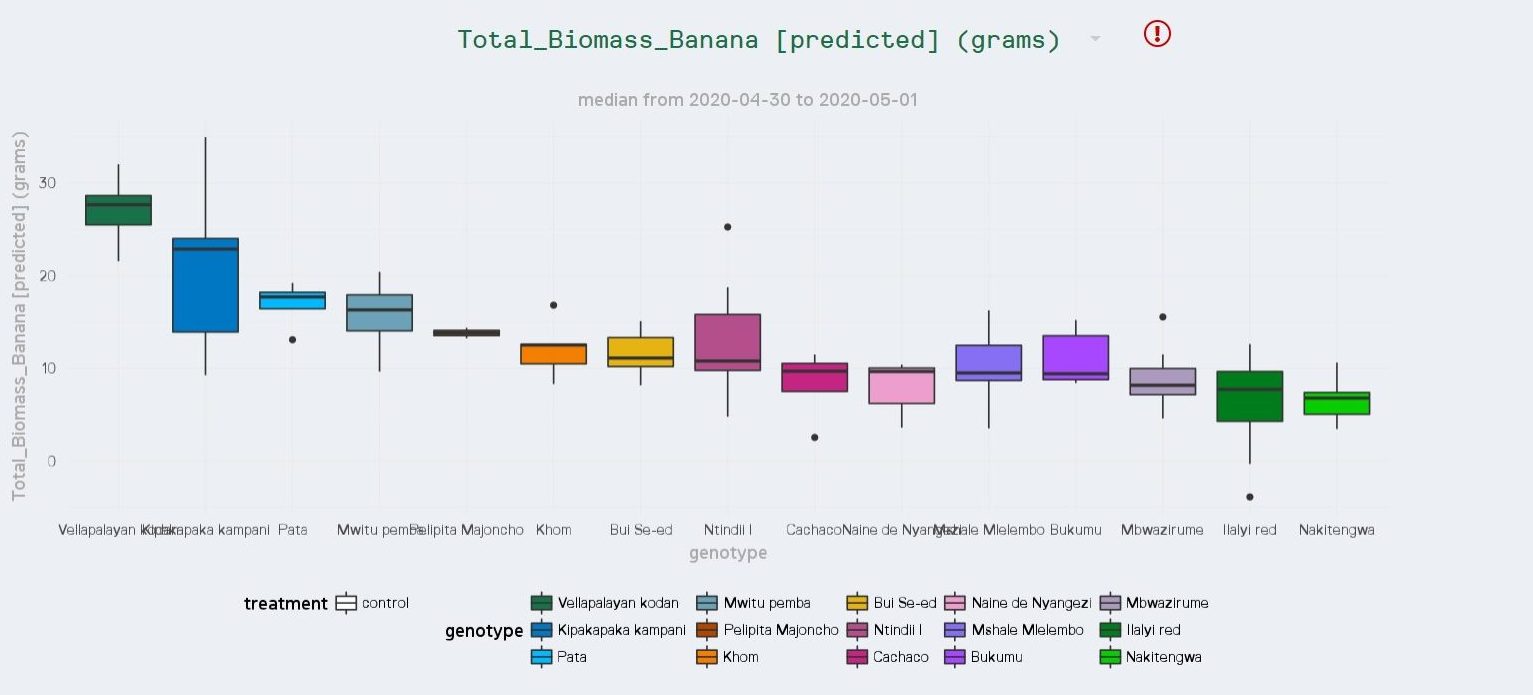
HortControl’s machine learning tool enabled Bioversity International to develop a high-throughput, automated method for predicting total biomass from PlantEye’s 3D spectral information.
A closer look at HortControl’s machine learning tool
The machine learning algorithm included within the HortControl software is built upon the simple mathematical method of linear regression. This can be used to create models that predict the relationship between two variables. The dependent variable is the predicted output, total biomass in our case study, which is based on an input, the dependent variable, such as leaf area. For more robust modelling, multivariate regression analysis performs lineage regression across many dependent variables to better refine the model and output prediction.
In this case, all 20 parameters measured by PlantEye were used as independent variables to establish a robust model with an R2 of 0.952. These included digital biomass, leaf angle and area, and plant height.
Phenospex has endeavored to make automated plant phenotyping of unique parameters widely accessible to all biologists, and this meant building a machine-learning tool that avoided the need for trained data scientists to implement and train the model. Applications of machine learning and computer coding can be off-putting to those not trained in the fields, yet HortControl enables access to a simple machine-learning tool through a straightforward interface that demands no statistical or coding knowledge.
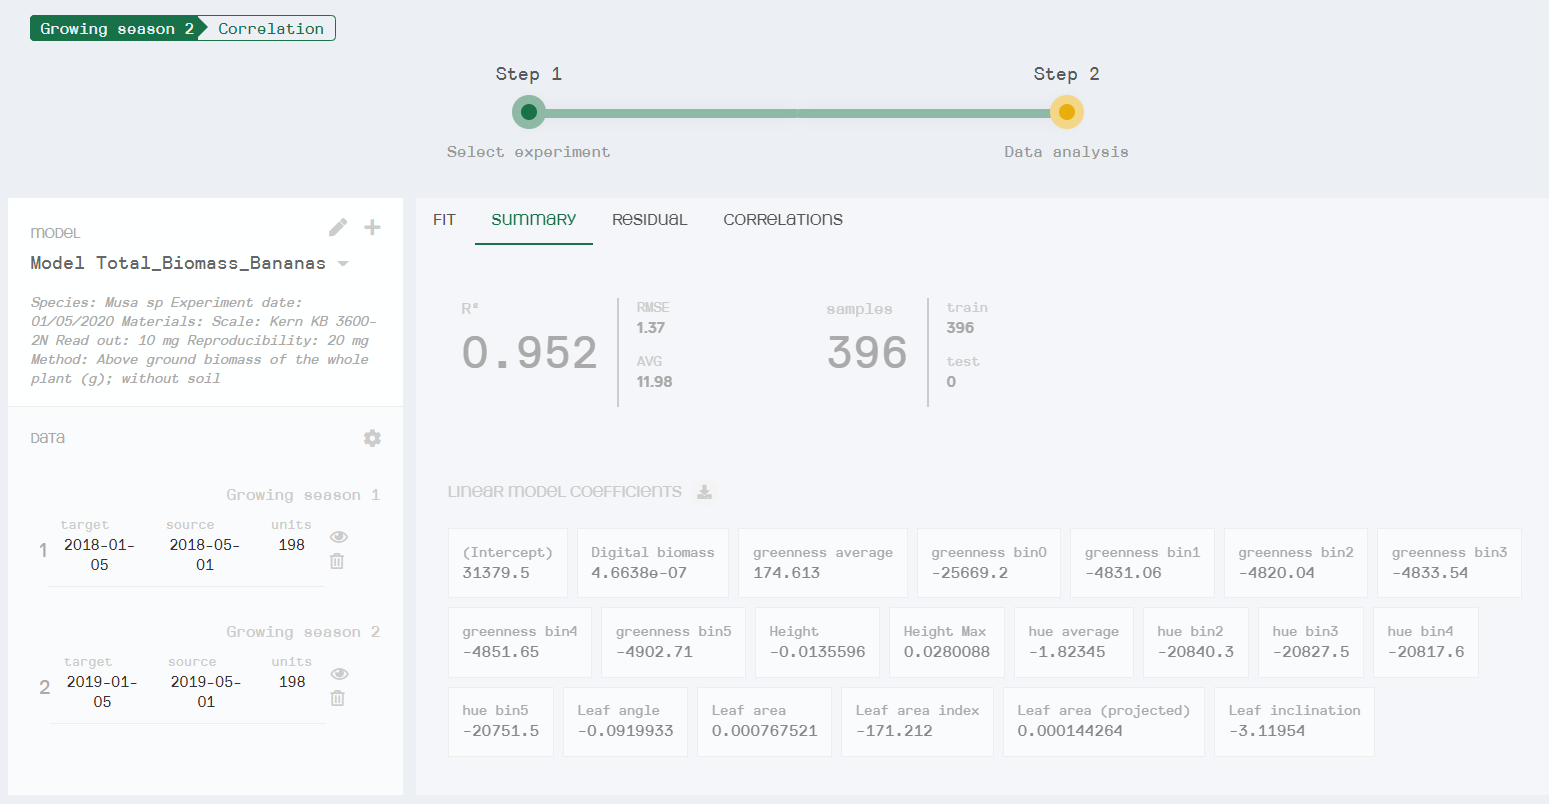
Summary of the multivariate regression model created to allow automated total biomass measurement at Bioversity International. Here you can see the equation of the linear coefficients (R2), root mean square error (RMSE), total sample size and sample size of each growing season. All digital parameters (dependent variables) used in this multivariate machine learning model are listed within the linear model coefficients section.
Conclusion
Applications of machine learning are beginning to revolutionize data science by providing powerful prediction algorithms that replace manual workflows. In plant biotech, these algorithms can be used to predict plant features in automated, high-throughput, and non-destructive processes. No longer requiring advanced statistical knowledge, machine learning platforms are now accessible through the user-friendly HortControl software. When unique or niche parameters need to be measured that are not covered by existing digital phenotyping tools, this machine-learning option provides a solution to automate any parameter that fits the requirements of linear regression. The up-front manual measurements required to build a training dataset provide a great return on investment as future phenotyping pipelines can be automated, saving time, resources, and human labor. Think of automating phenotyping methods like disease scoring, plant health scoring, and many others.
References
- Banana genetic resources and management systems [Internet]. [cited 2022 Dec 10]. Available from: https://www.bioversityinternational.org/research-portfolio/banana-genetic-resources-and-management-systems/
Contact us for more information
Would you like more information, a quote or a free consult? Contact us now and learn all about our digital phenotyping solutions and how they can fit in your process.