
APPF creates a digital phenotype library to build machine Learning algorithms for plant stress identification
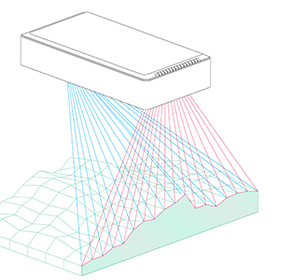
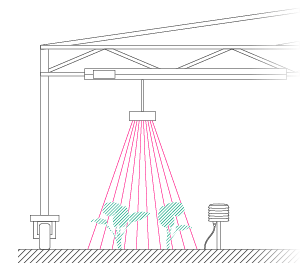
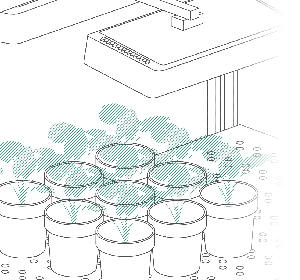
At the ANU node of the APPF, we acquired a Phenospex PlantEye DualScan F500 in November 2019 which was installed into one of our Photon System Instruments Growth Capsules, shipping containers which serve as high-precision controlled environments for plant growth. To date, the PlantEye has been used in a research project with Australian tobacco species Nicotiana benthamiana. As part of the project, we grow N. benthamiana in a range of environmental conditions to create a diverse collection of plant phenotypes. The plants are scanned regularly with the PlantEye to capture morphological and spectral phenotypic responses over time. We opted for a DualScan system for this work because N. benthamiana has a complex “bushy” plant architecture and a single sensor would not have been able to sufficiently capture the 3D structure of the plant due to leaf occlusion.
Analysing Phenospex data is intuitive and does not require complicated data pipelines
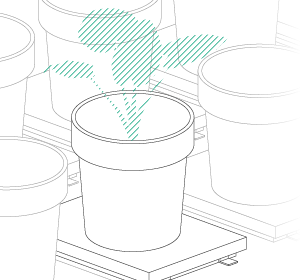
Ultimately, the project aims to build and train Machine Learning algorithms that can identify the type of environmental stress the plants experience based on their morphology and/or spectral reflectance to provide specific feedback to the grower. Training these models requires datasets from hundreds of plants and capturing this amount of data manually would be very challenging and would involve large amounts of plant material and staff time. The PlantEye provided non-invasive scanning to provide this data.
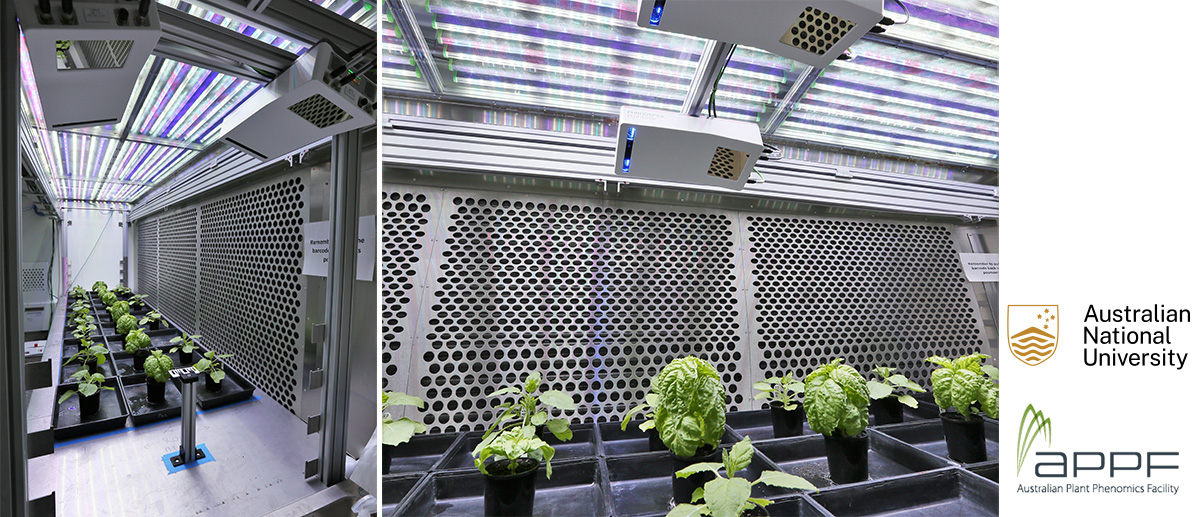
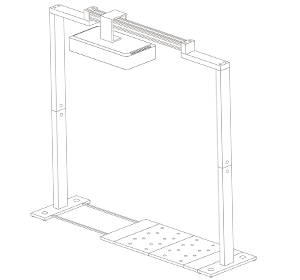
ANU APPF digital plant phenotyping platform of Phenospex in growth chamber
About APPF
The Australian Plant Phenomics Facility (APPF) is a national research collaboration facility with nodes at the Australian National University in Canberra (ANU), the Commonwealth Scientific and Industrial Research Organisation (CSIRO) and The University of Adelaide. APPF offers open access to state-of the-art plant phenomics technologies, tools and expertise not available at this scale or breadth in the public sector anywhere else in the world.

Dr Frederike Stock, Research Project Officer | Dr Richard Poire, Research Fellow
Australian Plant Phenomics Facility, Australian National University, Canberra
Read how APPF uses PlantEye in their collaboration with biopharmaceutical company Medicago.
Validation Experiments
We performed a range of validation tests for morphological features (biomass, plant height and leaf area) (Figure 1). We scanned plants at different development stages with the PlantEye and followed this with destructive manual measurements. All three parameters showed very good correlation with measurements obtained during destructive harvest. These results increased our confidence in the accuracy of the system and drastically reduced the amount of time-intensive destructive measurements to monitor biomass increase over time.
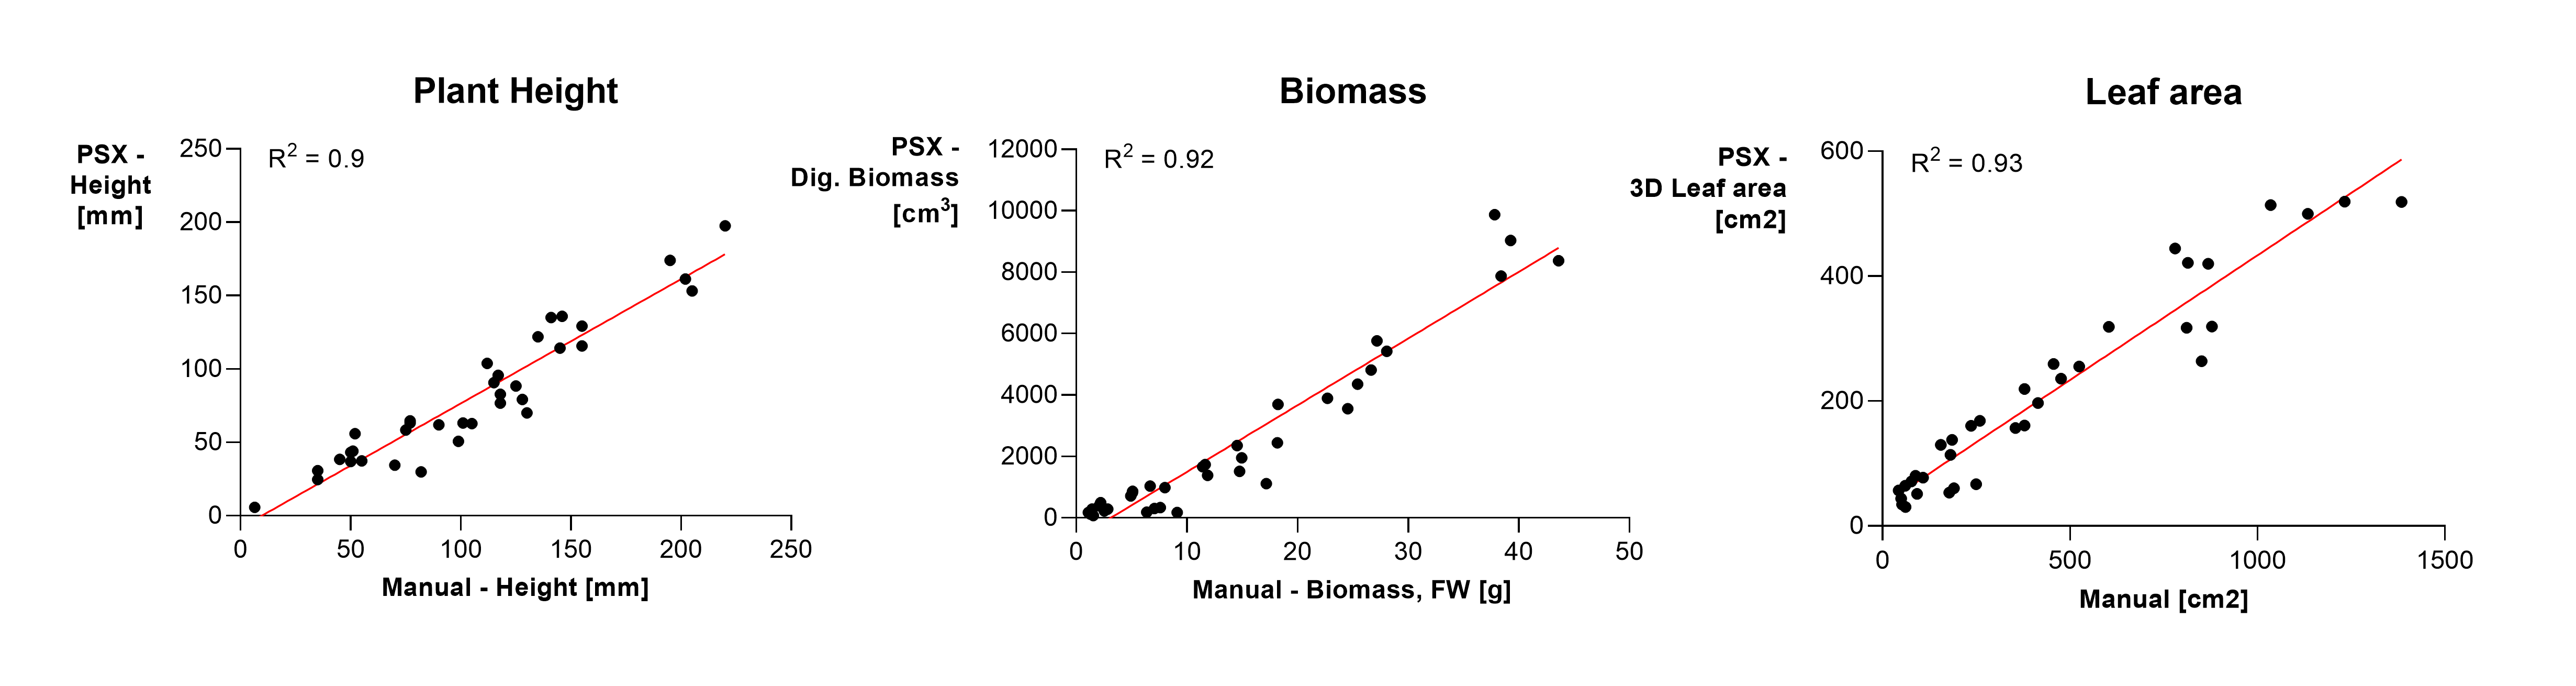
Figure 1. (click to enlarge) Scatterplots with trendlines (red) of manually collected data (x-axes) versus data collected by the Phenospex (y-axes), n=37. To test the reliability of the Phenospex plant scanner we tested the correlation of several plant traits, i.e. (a) plant height, (b) biomass, and (c) leaf area. R2 values of all plots were > 0.9 indicating a strong correlation between PlantEye data and manual measurements.
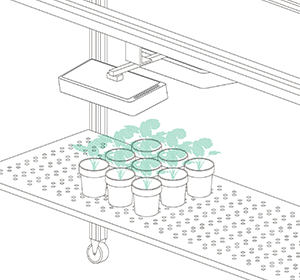
To date the Phenospex system has been very useful in identifying differences in plant growth (Figure 2), morphology and reflectance in different treatment groups. These results could only be obtained because we were able to take scans of dozens of plants every day and pick up signals outside of the visible range (NIR). Consequently, our Phenospex datasets have a much higher sample size and temporal resolution than data collected with any other sensor.
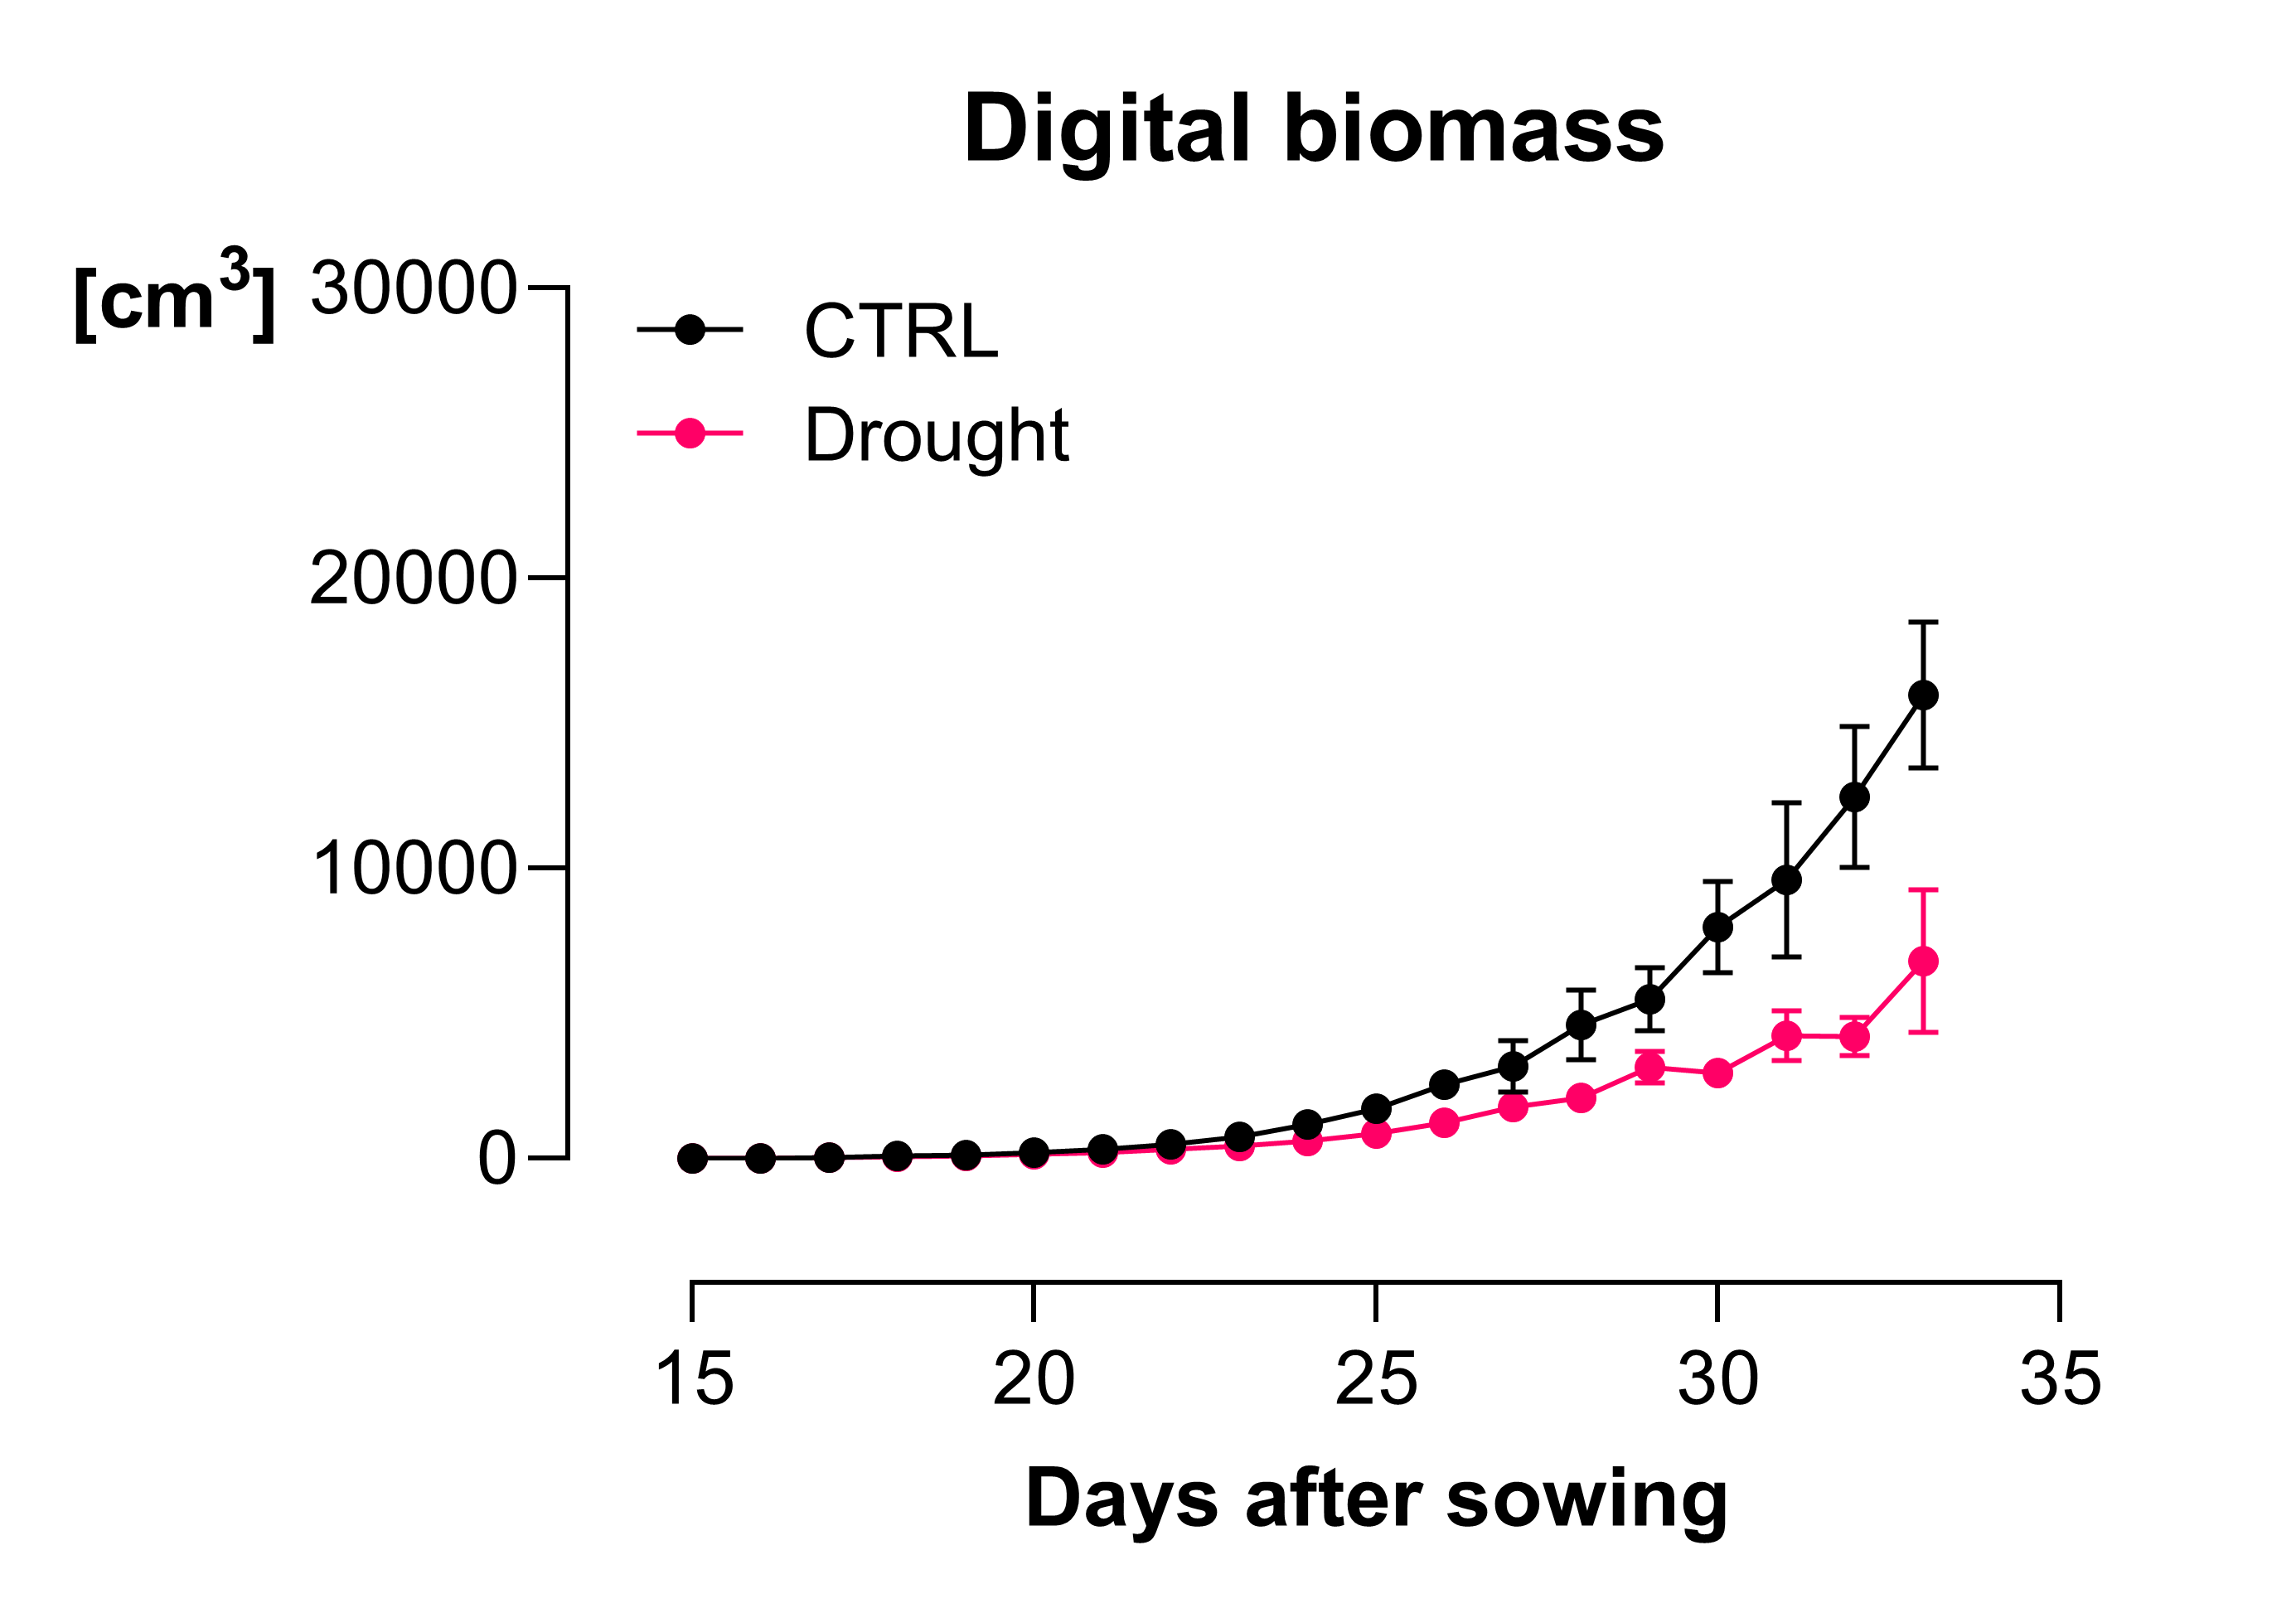
Figure 2. (click to enlarge) Biomass increase over time in N. benthamiana. In this experiment we investigated the effect of drought on plant growth, n = 6, error = SD.
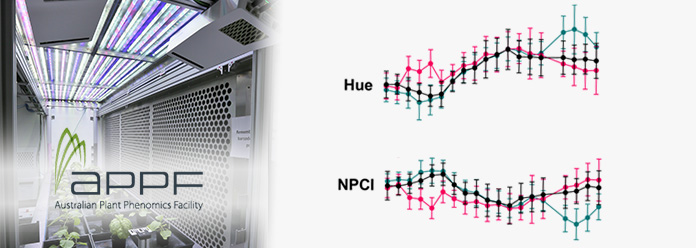
For example, we ran one experiment where we treated N. benthamiana with a 3-day heatwave at two different time points during plant development (16-19 and 29-32 days after sowing). Looking at digital biomass increase over time, we detected a slowing of growth during the later heatwave but could not detect any changes in growth during the earlier heatwave. However, we detected clear changes in spectral parameters like hue and NPCI (normalised pigment chlorophyll ratio index) immediately after the plants were exposed to hot conditions, during both the earlier and later heatwaves (Figure 3). These changes were not visible to the naked eye, highlighting the value of frequently capturing spectral features.
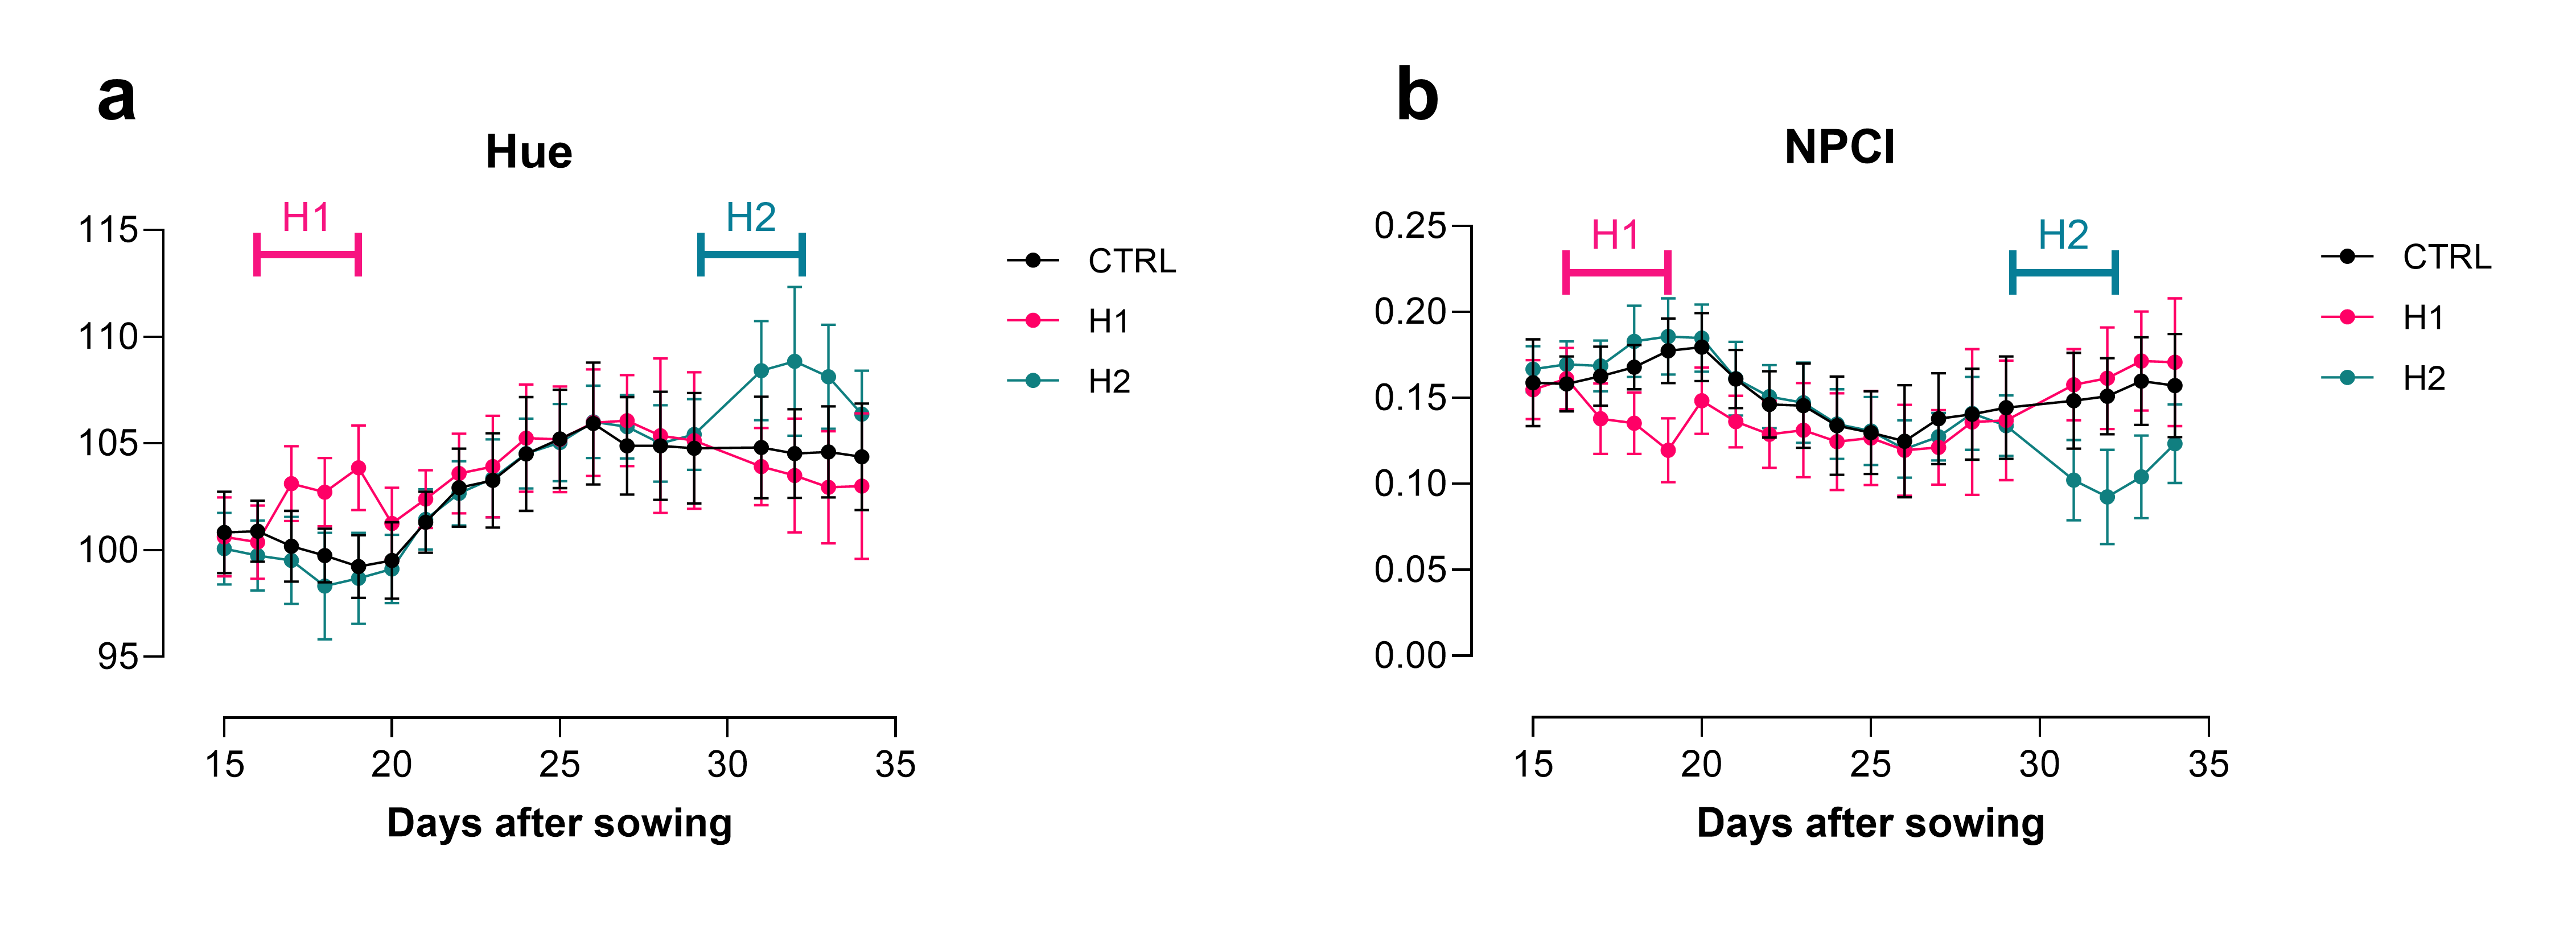
Figure 3. (click to enlarge) Phenospex measurements of (a) Hue and (b) NPCI of N. benthamiana. H1 = heatwave 1 (16 – 19 DAS), H2 = heatwave 2 (29-32 DAS), n = 5, error = SD.
Feedback on Phenospex, the system & service
Analysing Phenospex data is intuitive and does not require complicated data pipelines. One of its major advantages is that it provides data of more than ten plant features (ed. 20+ parameters with the new release), accessed in one data pipeline, compared to other sensors that collect data on one feature at a time.
We are very impressed with the quality of the data obtained from the Phenospex system
Getting started on using the Phenospex system was straightforward, thanks to the training we received from the technical support crew. Generally, the technical support by Phenospex deserves a shoutout; whenever we encountered an issue, we usually received a response by Phenospex within a day. The whole team seems dedicated to delivering good customer experience while also incorporating user feedback into improving their product. We really appreciate the relationship we have built with Phenospex over the last year.
Overall, we are very impressed with the quality of the data obtained from the Phenospex system, and we are considering an additional PlantEye system for our clients at APPF, as the system attracts further interest from a wider user base.