
PlantEye: A Reliable and Time-Efficient Alternative to Handheld SPAD Meter for Measuring Plant Health
Plant scientists and agronomists are constantly searching for reliable and efficient methods to assess plant traits. Whether it’s detecting water and nutrient stress, evaluating herbicide and biostimulants efficacy, or simply monitoring overall plant health, one frequent question we hear from customers is: Can PlantEye serve as an alternative to portable SPAD meters?
SPAD vs. PlantEye: Key Differences
The SPAD meter is a non-invasive tool that provides an instantaneous measurement of leaf absorbance in the red and near-infrared (NIR) wavelengths, generating a relative chlorophyll content score ranging from -9.9 to 199.9.
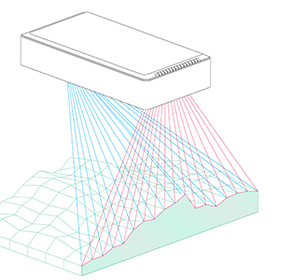
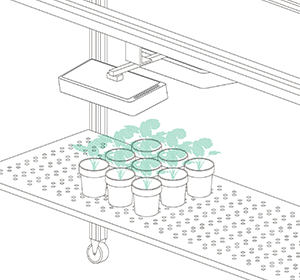
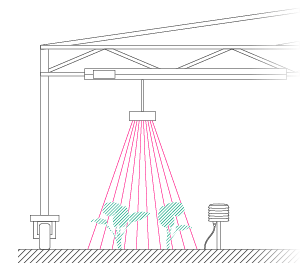
PlantEye, on the other hand, utilizes 3D scanning and spectral imaging to assess leaf reflection across the entire plant in the red, blue, green and NIR regions. From the red and NIR reflections, one of the most widely used plant health indicators—the Normalized Difference Vegetation Index (NDVI)—is calculated. Healthy leaves with high chlorophyll content absorb more red light and reflect more near-infrared (NIR) light, resulting in a high NDVI value (close to 1).
How Does PlantEye Compare to SPAD?
High Correlation: Plant NDVI highly correlates (R2 = 0.834) with plant SPAD measurements (upper, middle and lower leaves) in 3 weeks old soybean plants (Figure 1).
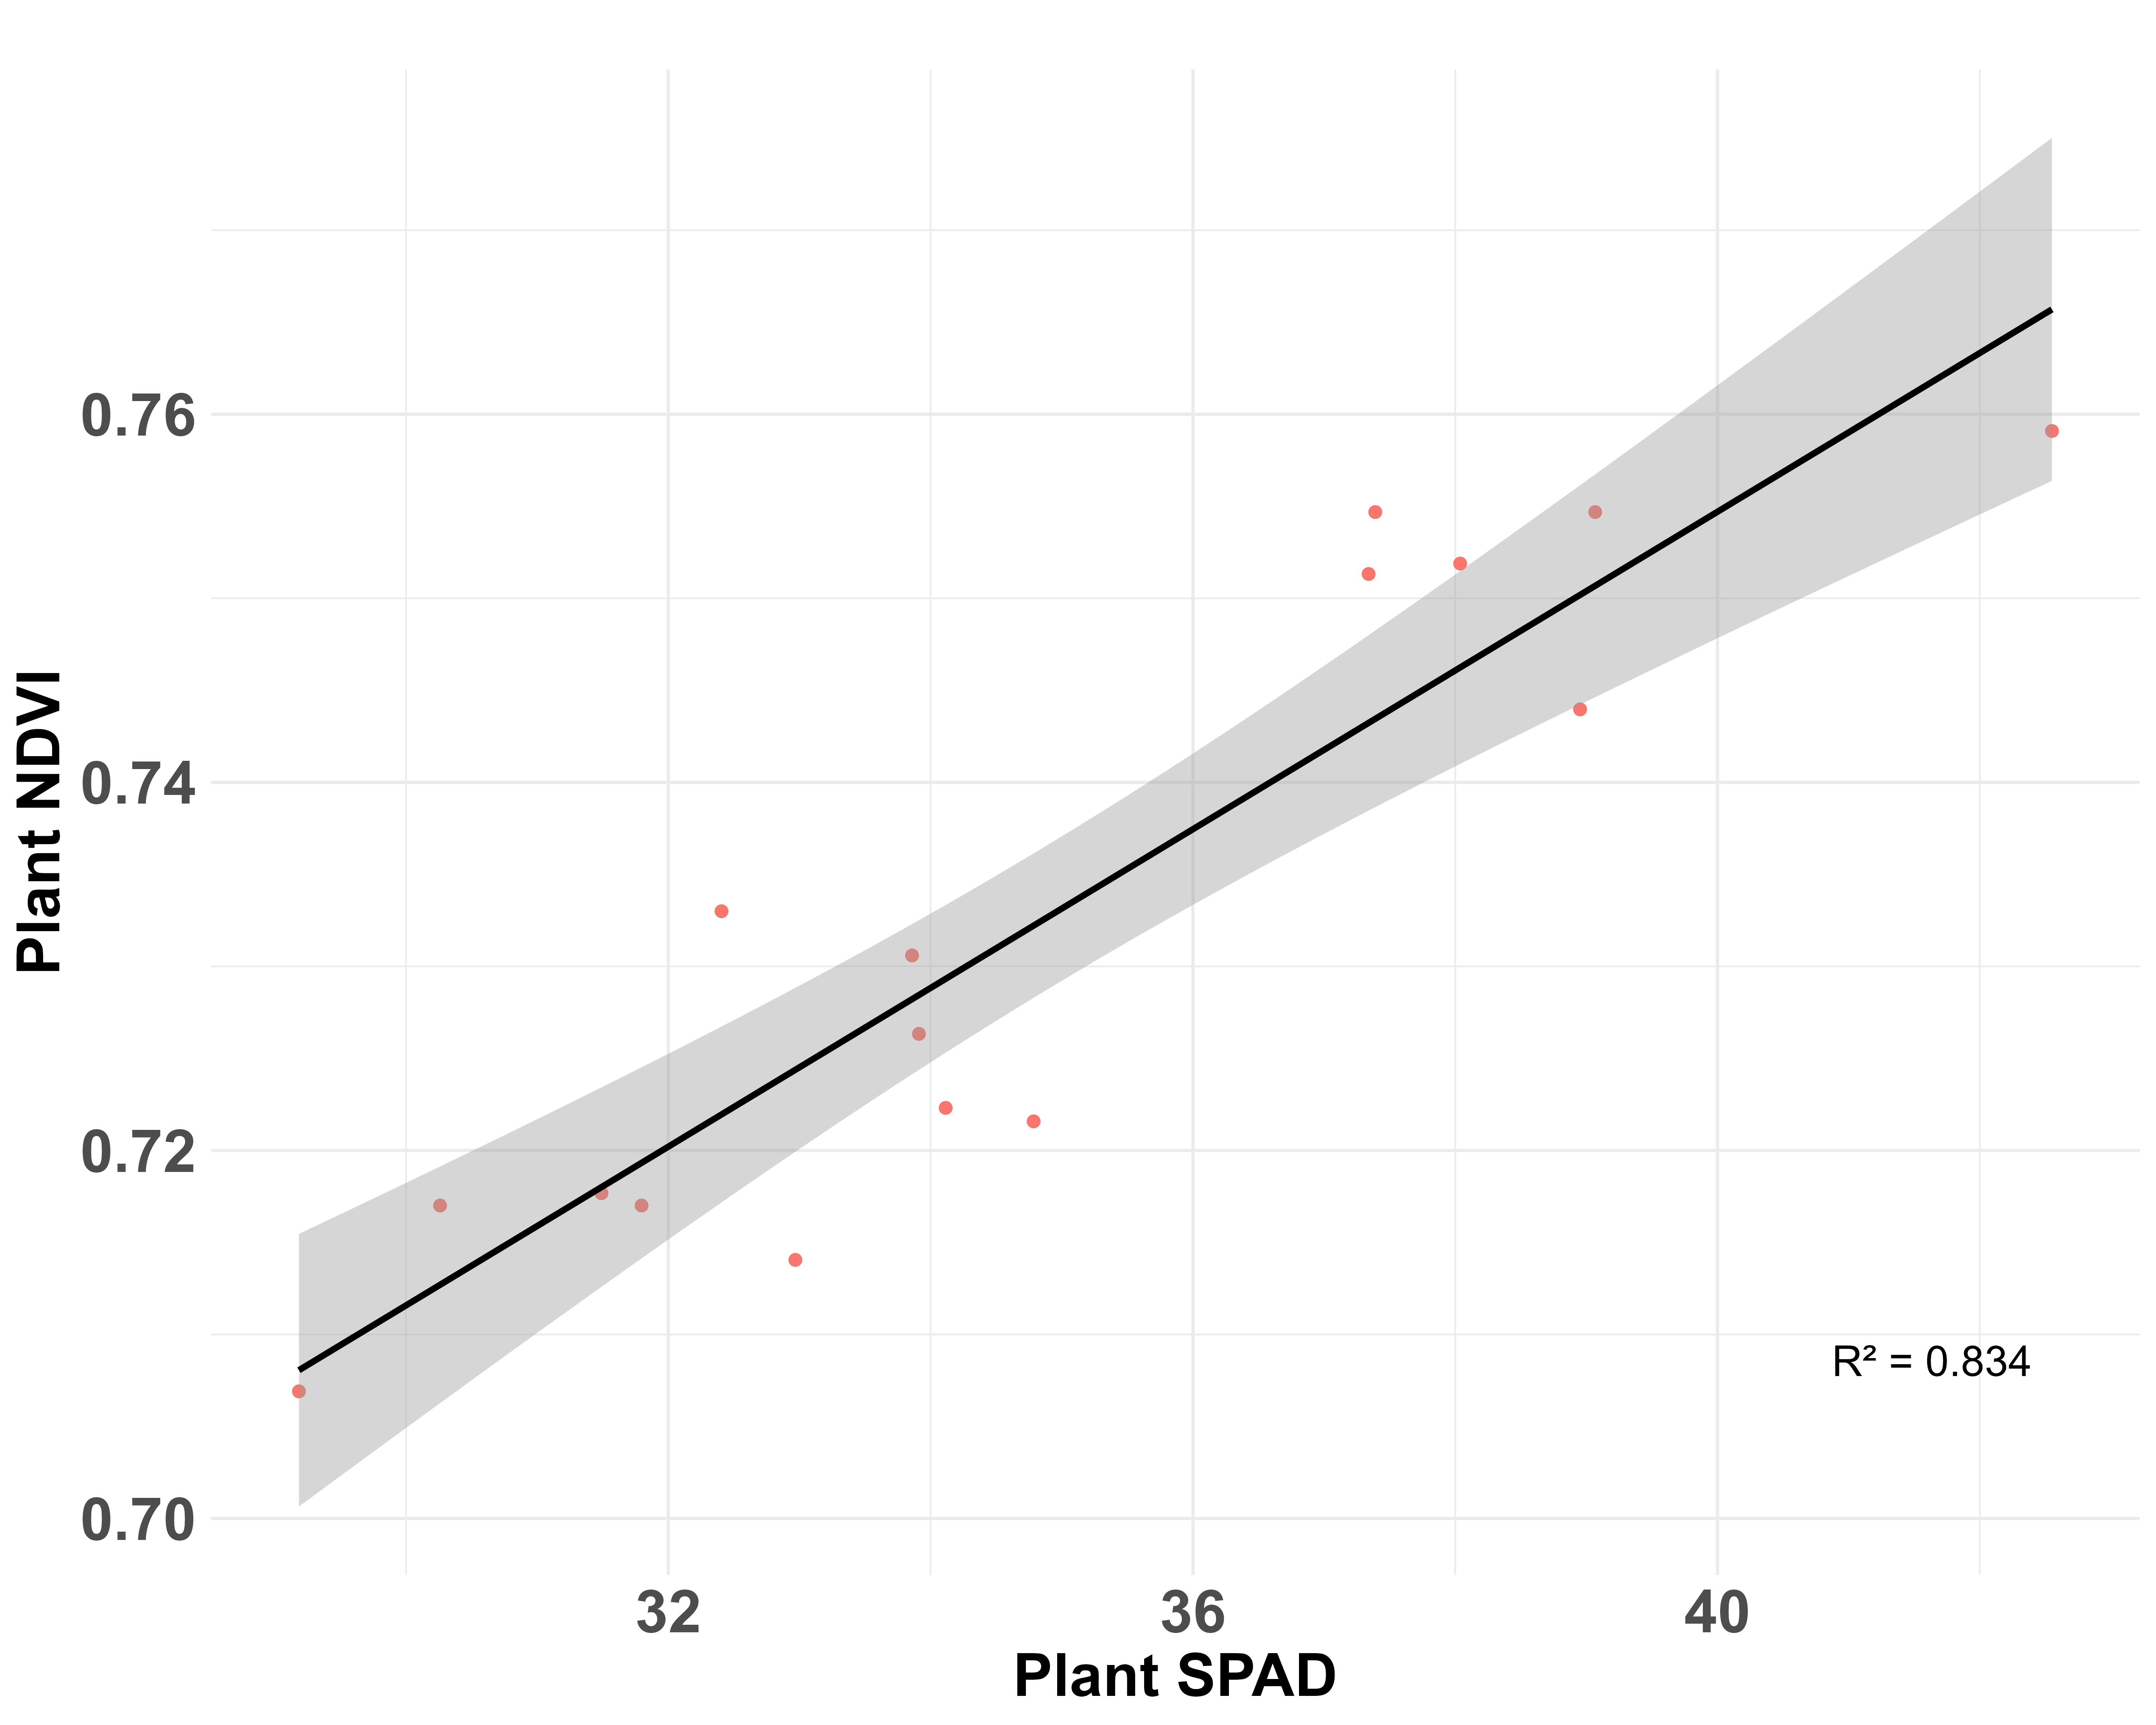
Figure 1. Plant NDVI and Plant SPAD (including upper, middle and lower leaves) were highly correlated (R2 = 0.834) in 3 weeks old soybean plants (n =16).
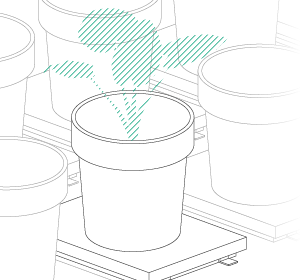
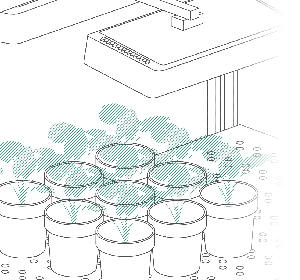
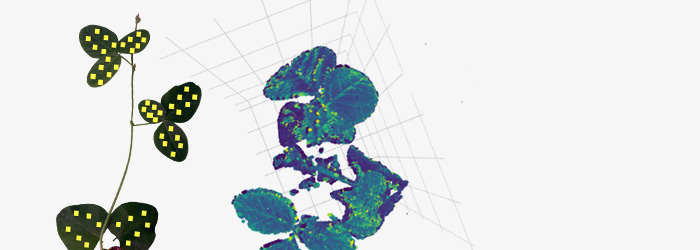
Example of one individual 3D plant model from one scan with NDVI valuesPicture of a soybean plant highlighting each SPAD measurement location in yellow.Same efficacy but using PlantEye was 50 times faster: SPAD measurements cover a small area (2 x 3 mm), making it extremely time-consuming to measure the entire plant. In our experiment with PlantEye we measured 16 plants in less than 2 minutes while with SPAD it took us more than 1hour and 30 minutes (Figure 2).
Comprehensive Data Collection: SPAD require researchers to select specific leaves for sampling. Focusing solely on upper, middle, or lower leaves can lead to lower correlation with PlantEye measurements. PlantEye averages reflectance over entire plants, ensuring more representative data.
ConclusionWith a strong correlation between PlantEye and SPAD, and significant time-saving benefits, PlantEye can be an alternative to the SPAD meter and increase efficiency in large-scale assessments.Would you like to explore whether PlantEye is the right fit for your research or agronomic applications? Get in touch with us !
| PlantEye F600 | Handheld SPAD-502Plu0s |
 |
 |
|
Aspect |
PlantEye F600 |
Handheld SPAD-502Plus |
|---|---|---|
|
Time per Assessment |
One scan (8 plants): 40 seconds |
One plant assessment: 6 minutes |
|
Total Plants Assessed |
16 plants |
16 plants |
|
Total Assessment Time |
Less than 2 minutes |
More than 1 hour 30 minutes |
Comprehensive Data Collection: SPAD require researchers to select specific leaves for sampling. Focusing solely on upper, middle, or lower leaves can lead to lower correlation with PlantEye measurements. PlantEye averages reflectance over entire plants, ensuring more representative data.
|
If customer would measure only upper leaves |
If customer would measure only middle leaves |
If customer would measure only lower leaves |
If customer would measure all leaves |
|---|---|---|---|
 |
|
|
 |
|
R2 = 0.447 |
R2 = 0.129 |
R2 = 0.621 |
R2 = 0.834 |


Conclusion
With a strong correlation between PlantEye and SPAD, and significant time-saving benefits, PlantEye can be an alternative to the SPAD meter and increase efficiency in large-scale assessments. Would you like to explore whether PlantEye is the right fit for your research or agronomic applications? Get in touch with us!