
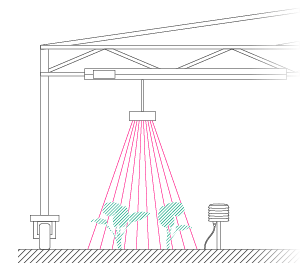

Optimizing Spectral Binning for PlantEye Products
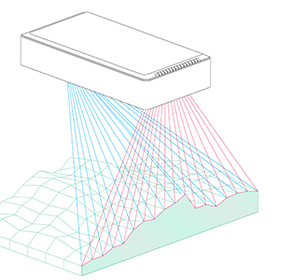
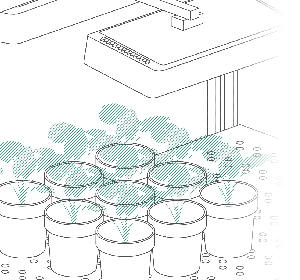
Are you looking to improve the accuracy of quantifying symptoms such as chlorosis, yellowing, or necrosis? HortControl offers a key advantage: it quantifies plant areas showing these symptoms based on their spectral values. This process, called “binning,” groups all plant material with a certain spectral value into a “bin,” allowing for precise quantification. For example, one bin can contain all plant tissue showing signs of nutrient deficiency.
However, the effectiveness of this method depends on accurately determining the bin thresholds. To support our users, we have developed a Method Note (download below), providing a step-by-step guide to identifying optimal bin-thresholds tailored to your experiment.

Case Study: Quantifying Local Nutrient Deficiency Effects in Soybean Plants
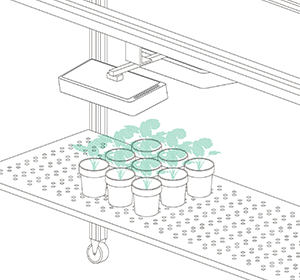
This Method Note is based on a case study examining nutrient deficiency in soybean plants. Deficiency symptoms appear as yellowing in older leaves and, in severe cases, along the leaf edges in the upper canopy. Spectral binning helps quantify the proportion of affected plant material, aiding in the identification of products that alleviate these symptoms. Setting the correct bin thresholds is crucial, as they vary based on crop species, symptoms, and growing conditions.
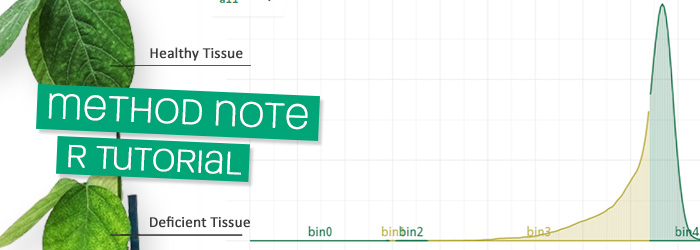
Method Note:
Optimizing Multispectral Binning
To optimize spectral bin thresholds, the Method Note outlines three independent approaches:
- Visual Evaluation (CloudCompare) – A manual, no-code approach for direct visual assessment.
- Differential Expression Analysis (R) – A statistical method to define thresholds.
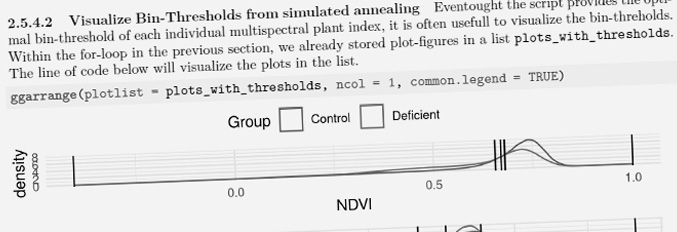
- Simulated Annealing (R) – An algorithmic optimization technique for refining bin thresholds.
Beyond the step-by-step descriptions of each method, the Method Note also provides:
- Theoretical insights into the binning process.
- Practical tips for working with 3D PLY files.
- A strategy to prevent overfitting by calibrating bin thresholds using negative and positive controls from your trial.
Download the Method Note and learn how to apply these techniques to your experiment.
Download
In this download you will find the paper, R-scrips and PlantEye demo data. Fill the form below and you will receive a download link on your e-mail:
*click once and check your email. Due to a technical error you will not get direct feedback here.