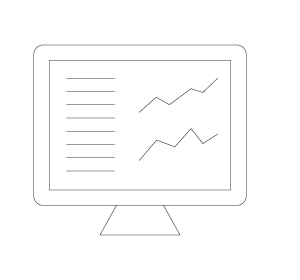
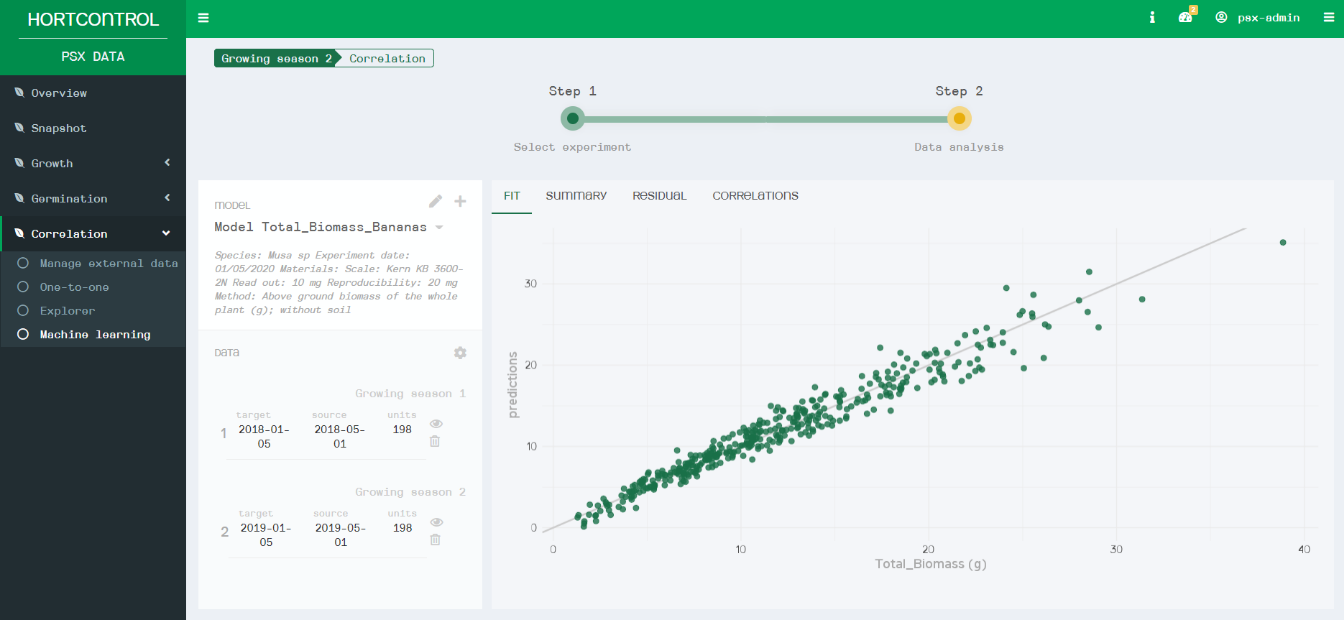
The simple interface of the HortControl software makes machine learning accessible to all. The graph visualises the fit between the manual measurements (X axis) and the measurements predicted by the model (Y axis).
The simple interface of the HortControl software makes machine learning accessible to all. The graph visualises the fit between the manual measurements (X axis) and the measurements predicted by the model (Y axis).