
 Posted on 16 September 2026 in case story, client, Collaboration, digital phenotyping, DroughtSpotter by admin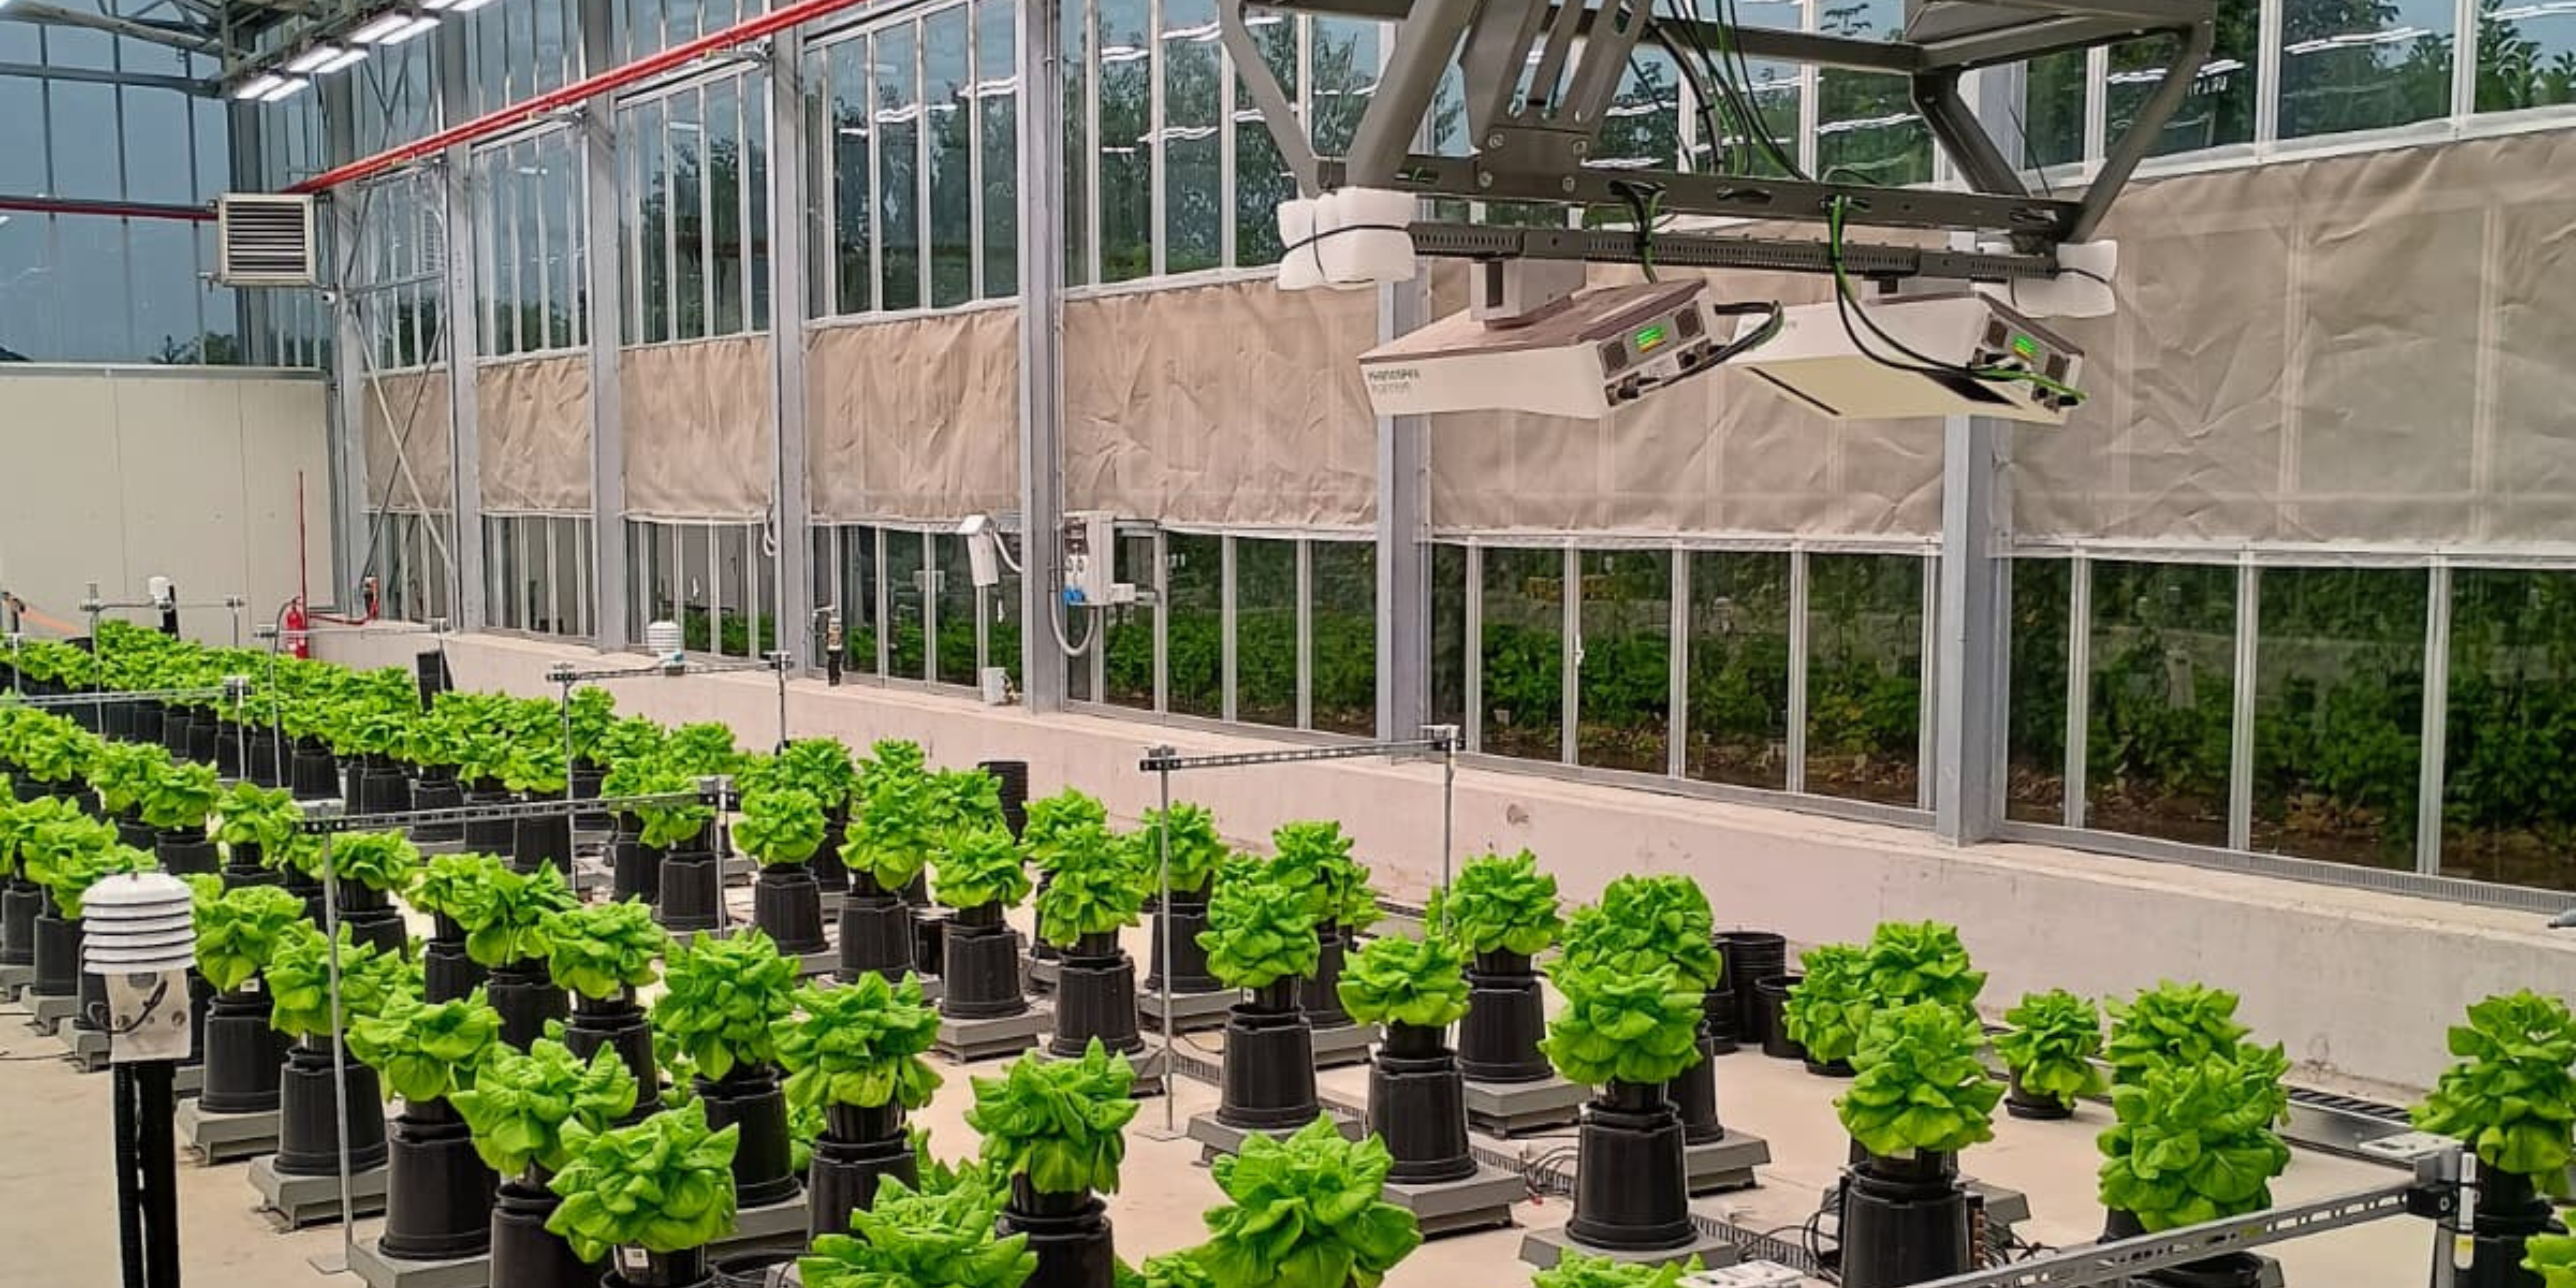
Customer Interview with PlantFlowSolutions
“The limitation isn’t the technology, it’s the experimental design”
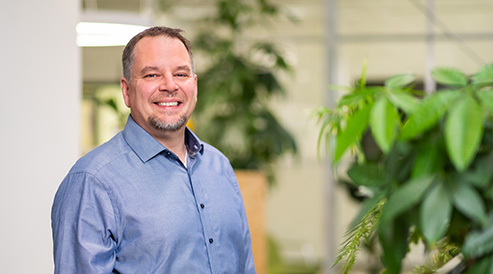
Davide Patono, CEO & CTO |
 |
a contract research organization (CRO) specializing in biostimulant research and complex agronomic trials. Their team integrates physiological measurements, controlled-environment simulations, and data-driven insights to accelerate scientific development for their clients. |
What does Plant Flow Solutions do?
DP: “The company was born three years ago, and our first goal was to support the agritech sector in developing their product. We provide both scientific and practical support, and we also design and carry out experiments and realize them for our customers. So our mission is to design and realize more precise and higher-quality trials.”
What made you turn to digital phenotyping in the first place?
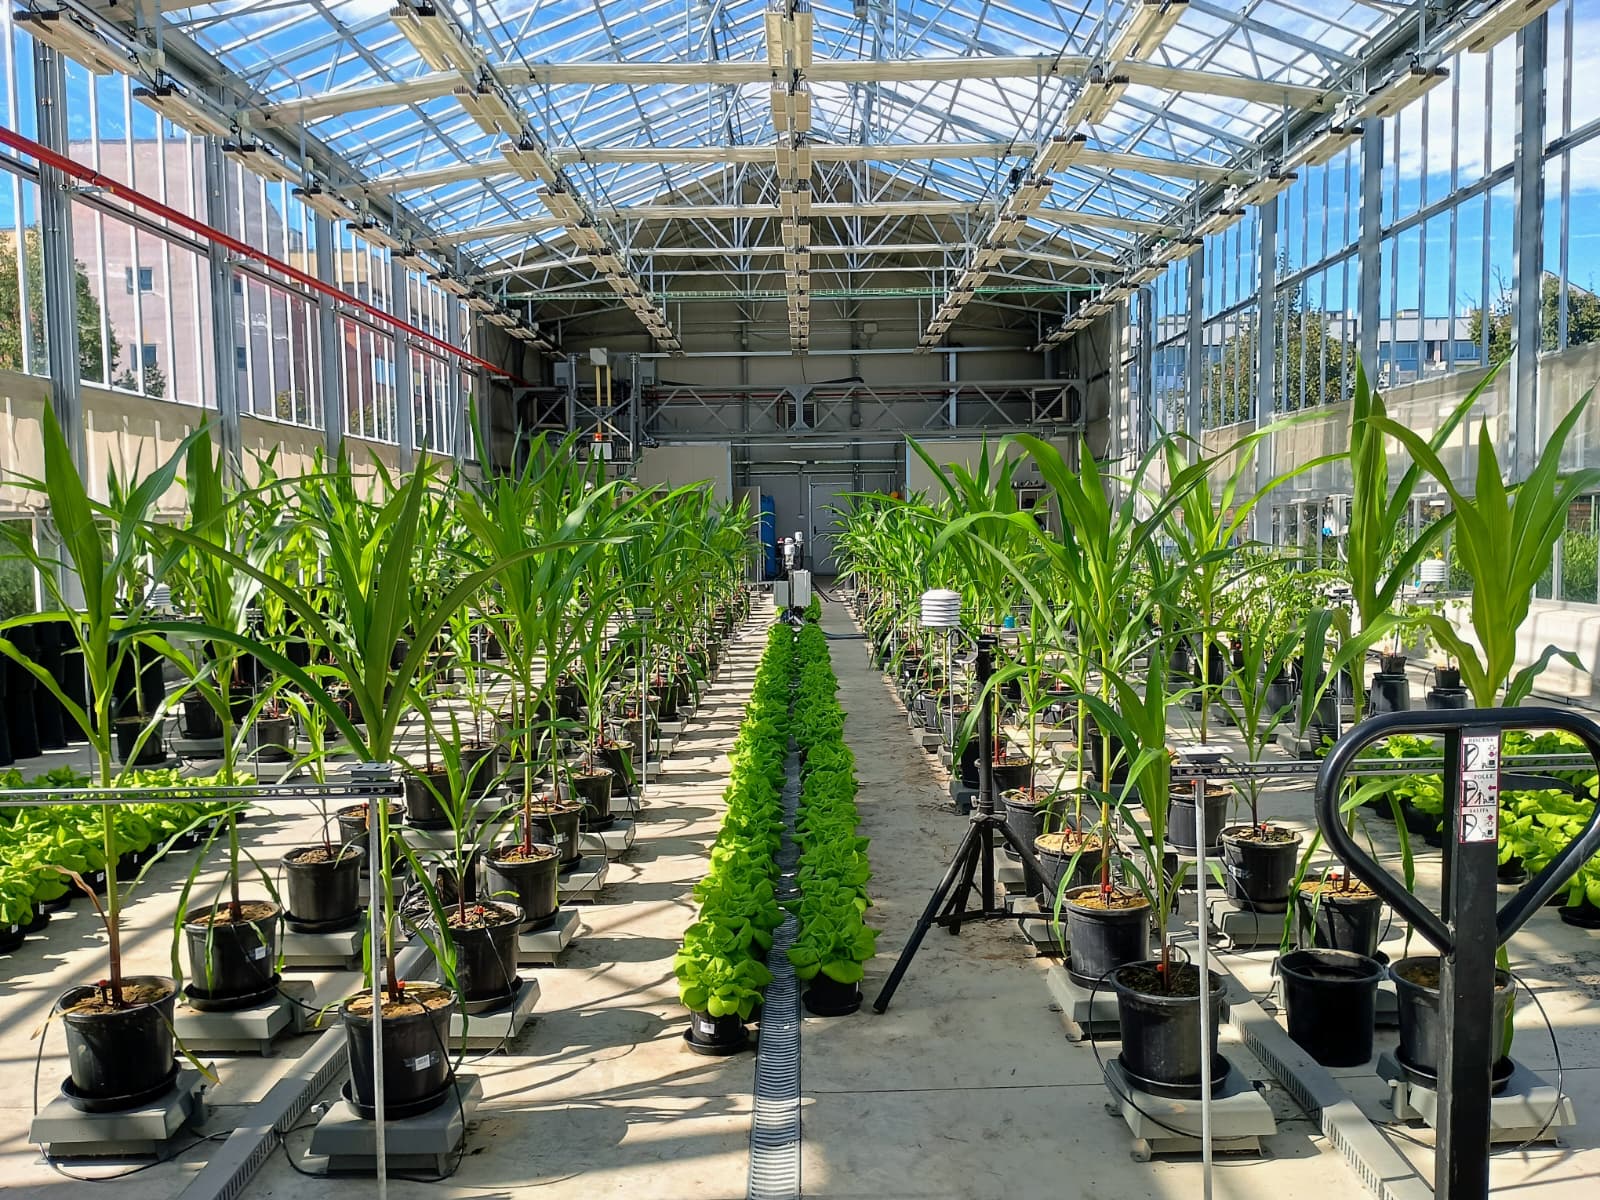
DP: “The main reason is scalability. Today, we run screening trials with over 200 plants simultaneously using the facilities of the University of Turin. Doing that with manual measurements alone would require a massive team taking readings day in and day out. So, originally our co-founder Professor Claudio Lovisolo selected Phenospex as the best balance between cost, performance, and flexibility. The gantry height fits easily between small and tall crops, giving us the exact throughput and versatility we need to scale our trials reliably.”
How do you combine PlantEye and DroughtSpotter with your other measurements?
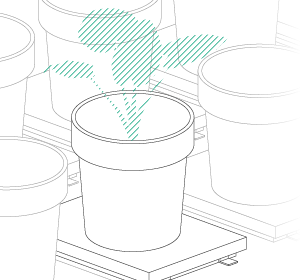
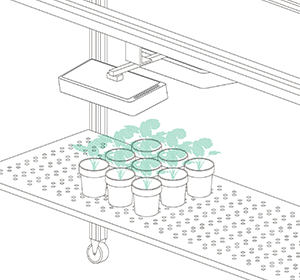
DP: “We integrate digital phenotyping with direct measurements of plant performance, using techniques that are considered the gold standard in plant physiology. With DroughtSpotter, we manage the irrigation regime to induce plant water stress, and PlantEye gives us the day-by-day kinetic of traits like canopy volume and loss of turgor. We combine this with direct measurements like gas exchange or water potential. Putting all this data together gives us a very clear picture, because the measurements don’t contradict each other and help us achieve a more accurate interpretation of the plant response.”
The result is a working style built around scale. Plant Flow Solutions’ standard is eight replicates per treatment, and trials now run with 200 or more plants at once.
Why did you measure plants twice a day, at night and in the late afternoon?
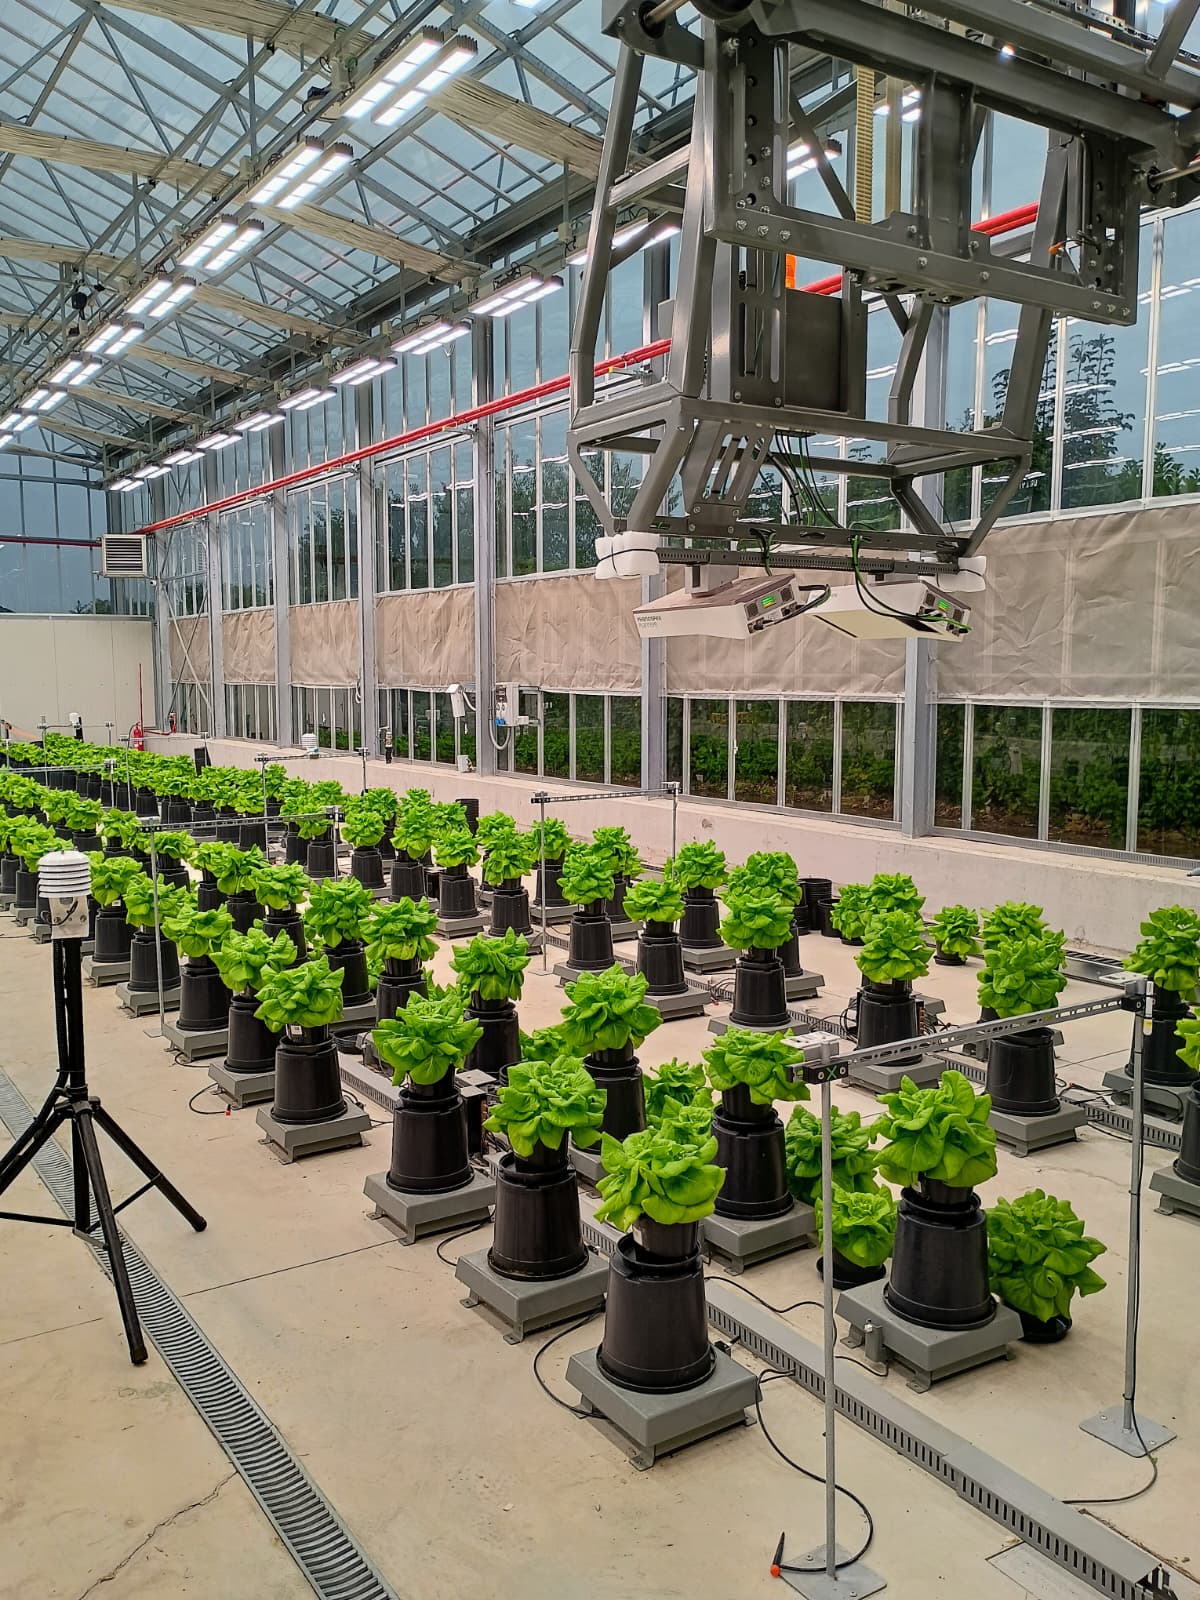
DP: “We perform two measurements every day. One in the middle of the night, when the plant has had the opportunity to recover as much as possible from the water deficiency during the day. The shape of the plant is more related to the water availability in the soil, so it’s easier to follow a clear kinetic. We also measure in the late afternoon, when the plant is most stressed, but that moment is harder to read, because it depends a lot on the environmental conditions. Maybe one day is hot and sunny, and the plant has a completely stressed shape. The day after is cloudy, and the same plant at the same time looks completely different.”
What’s the most surprising result you’ve seen with this approach?
DP: “It was my second experiment with this technology. We applied a biostimulant that had a very strong effect. I was able to recognize which plant was treated just by looking at it, without checking the label. I touched the leaves, I understood there was some difference in thickness, the shape was a little different, but I wasn’t able to understand why. It was an experiment on grapevine, and in the end PlantEye helped us realize that there was a completely different surface angle of the leaves. The biostimulant changed the structure and the turgor of the leaves, and I had never measured that trait before.”
I recognized the treated plant just with my eyes, but I wasn’t able to understand why. It was a trait I had never measured before.
How much does timing matter when testing a biostimulant?
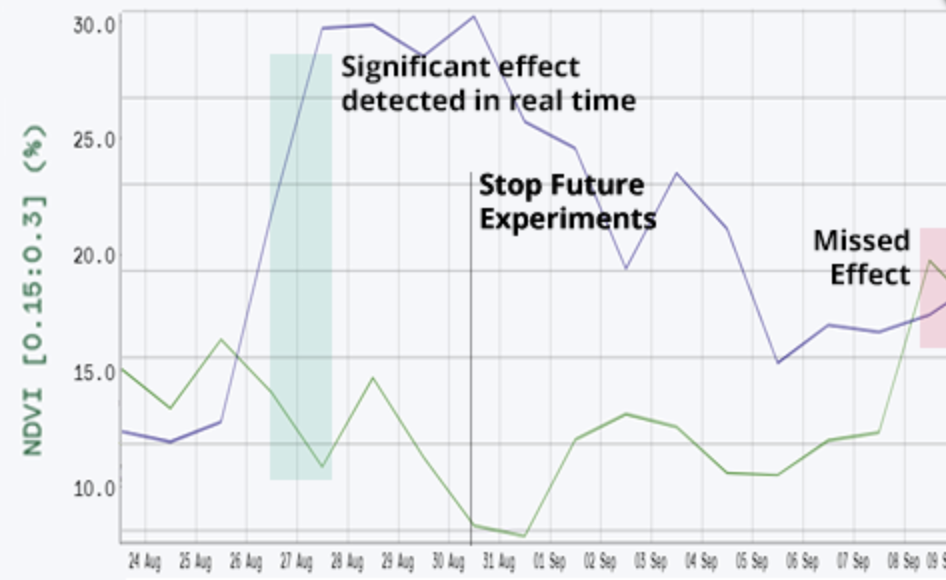
DP: “In the past we had an experiment where we applied a biostimulant three times. We were able to understand that already after the first treatment there was a clear effect on the physiological responses. So probably you can use just one application, you don’t need three. And with a good time series, you can also understand how many days before a stress you need to apply the product, so it’s very helpful to orient the agronomic practice.”
Is there a single trait that tells you whether a biostimulant is working?
DP: “It depends. We use a lot of reflectance indices because they’re very sensitive, for example to sunburn or nutritional stress. But the same value can have two different interpretations depending on the stress status of the plant. Surface angle is very good for grapevine, but it’s not always a good trait for other crops. For corn, leaf area or the volume of the plant is a very clear trait, because corn rolls its leaves during stress. So it’s not one trait, it’s about which trait is the most useful for the model you’re studying.”
What’s actually holding the sector back, technology or something else?
DP: “The technology that’s on the market now, PlantEye, DroughtSpotter, they provide very good and scientific results. What needs to be improved is not the technology, it’s the procedure, the methodology, the design of the experiment. That’s what we’re working on.”
The limitation, from my perspective, is not the technology. It’s the procedure, the methodology, the design of the experiment.
If you told another researcher one reason to switch to digital phenotyping, what would it be?
DP: “I could tell you many advantages, but just one is that you have the opportunity to find exactly the moment in which you can find some effect of the product that you are testing. With direct measurements, you’re limited to the days you’re in the greenhouse. With digital phenotyping, you have all the days, and you can see responses in conditions you weren’t expecting, in a phase of the day you wouldn’t have focused on otherwise.”
Davide also credits the ongoing relationship with the team behind the technology.
DP: “I know the Phenospex team is working a lot on the software to improve quality and make it easy and comfortable to use for the final user like me.”
Greenhouse Phenotyping
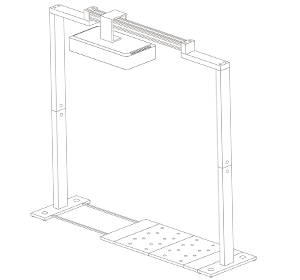
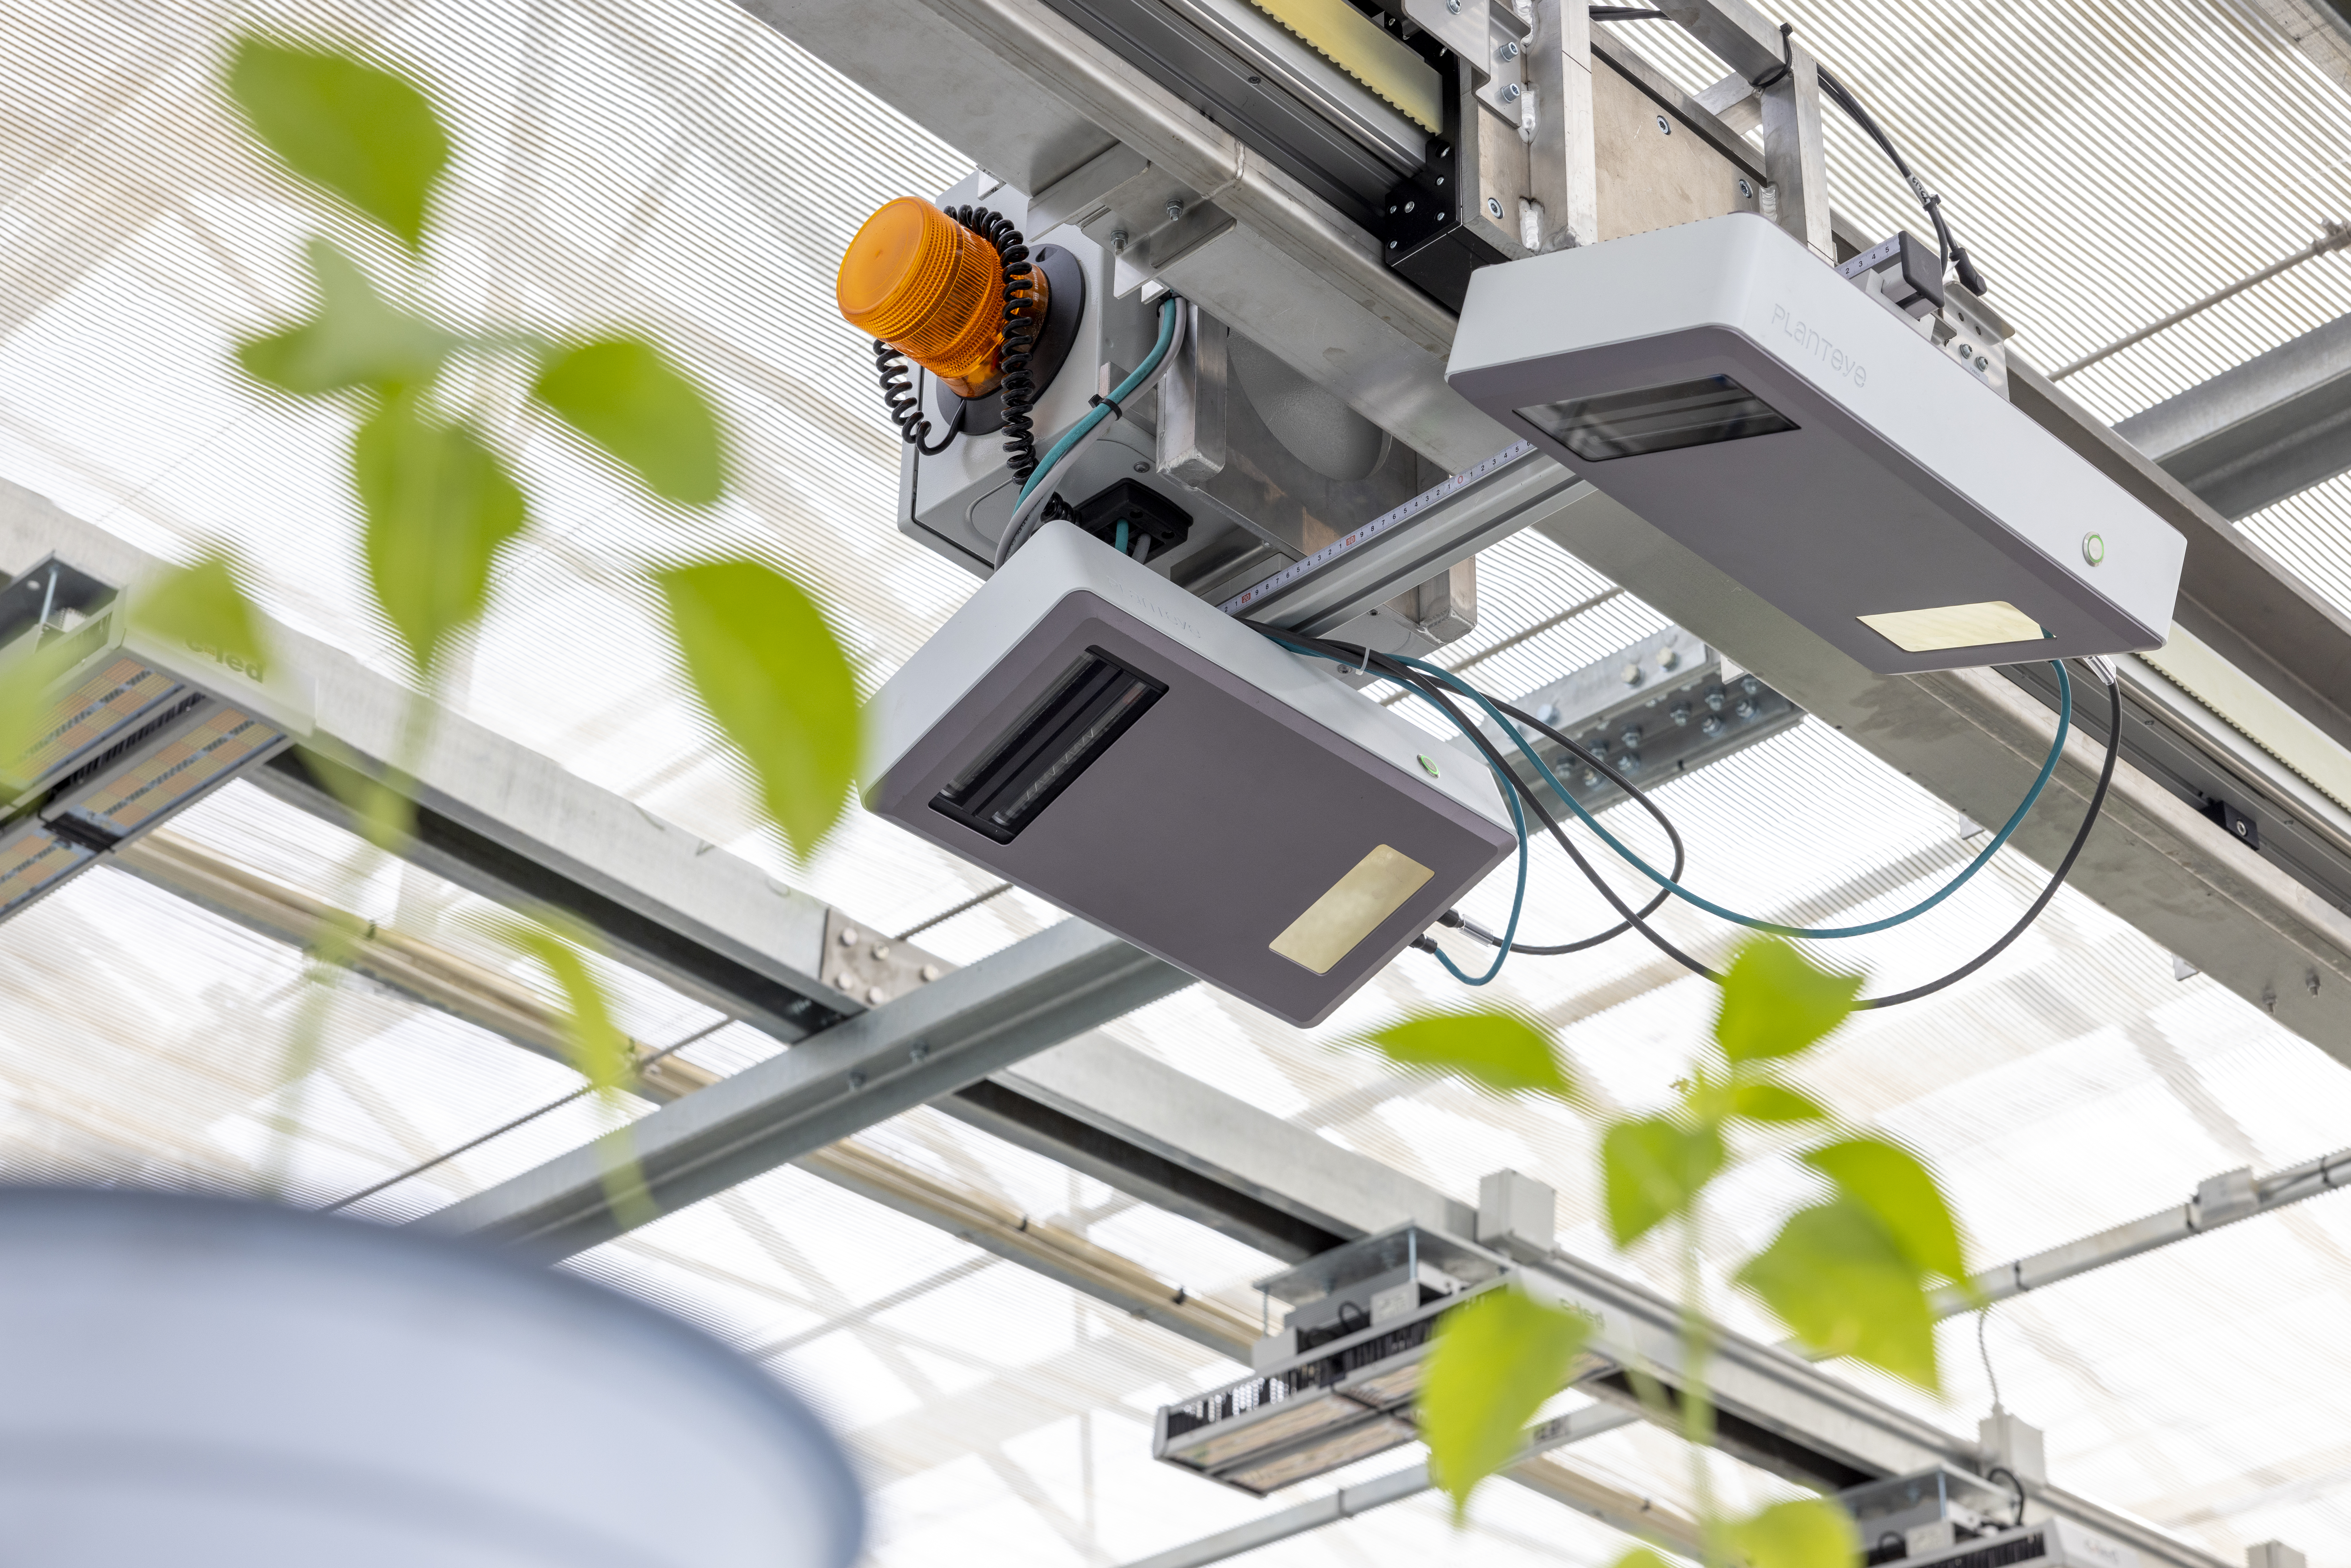
Plant Flow Solutions used H-Portal to automatically monitor plants throughout their experiments in the greenhouse. It combines PlantEye sensor technology with HortControl software for an automated phenotyping workflow.
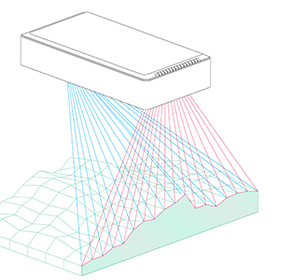
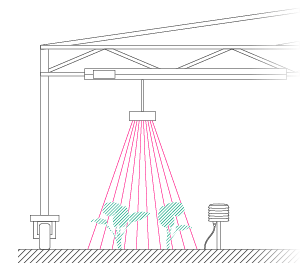
PlantEye scans plants non-destructively, capturing traits such as digital biomass, leaf area, growth and NDVI. HortControl designs and automates the experimental workflow, monitors plant growth, and processes raw measurement data into clear, ready-to-analyze traits.
 |
 |
| PlantEye | HortControl |
Key benefits:
- ✔Automated, non-destructive measurements
- ✔High-throughput phenotyping
- ✔20 digital traits
- ✔Continuous time-series data
Interested in finding the right solution for your trial design?
Would you like more information on how to design higher-quality, higher-throughput trials with digital phenotyping? Contact us now: