

HortControl Analyze & visualize Plant Sensor Data
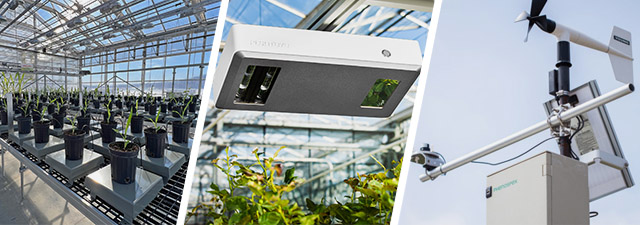
HortControl is the central software to setup, visualize and analyze the data from all sensors build by Phenospex (PlantEye, DroughtSpotter & Weather Station). Designed to be used by staff with any professional background. Check and visualize all your data wherever you are.
- Experiment setup, control & monitoring
- Data visualization, aggregate data & visualize parameters in professional graphs
- All sensor data Centralized, PlantEye, DroughtSpotter, Weather Station
- Plant analysis tools, e.g. growth analysis, Germination analysis
- Correlation & machine learning tools, Faster validation studies
- HortControl API, Automate the data transfer into any other workflow
![]()
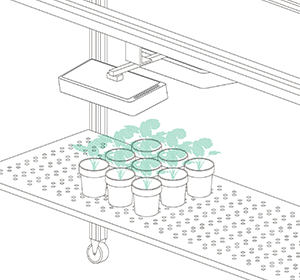
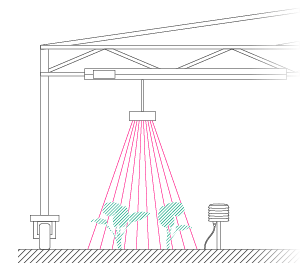
Experiment set-up, control & monitoring
HortControl’s experiment setup can create experiments with one or multiple sensors and gives tips on your experimental design. Once your experiment is running you can monitor the data, reprocess the raw data with new experiment settings or immediately start analyzing.
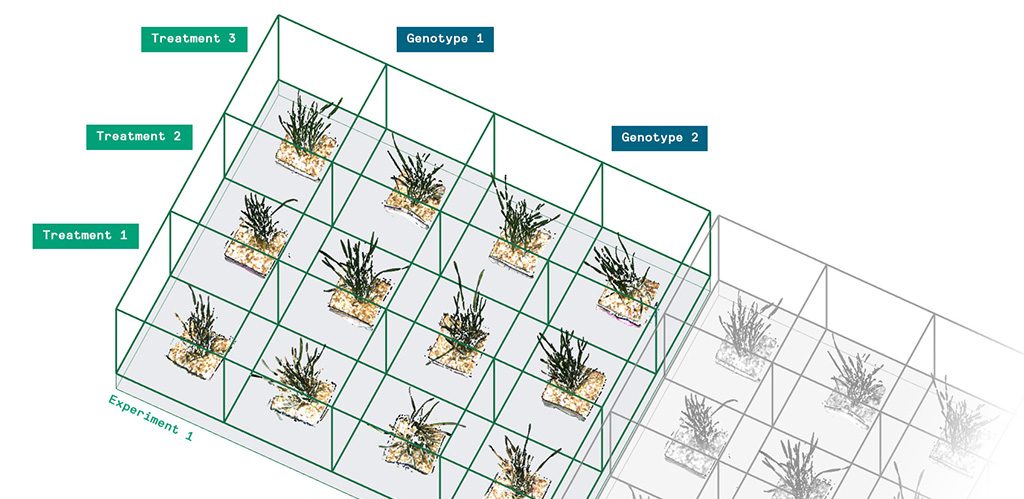
- Set-up experiments for large numbers of plants with different genotypes and treatment groups
- Monitor experiments & crops in real time
- Reprocess raw data recalculate plant parameters with new settings
- Monitor hardware and sensors status
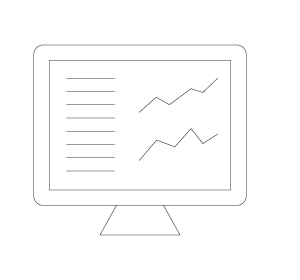
Visualize Plant Data
Visualize all plant parameters with HortControl. Easily create the graphs you need to analyze your plants with features such as:
- Time aggregation
- Grouping on genotypes and/ or treatments
- Absolute or relative values
- Filter on time, treatment or genotypes
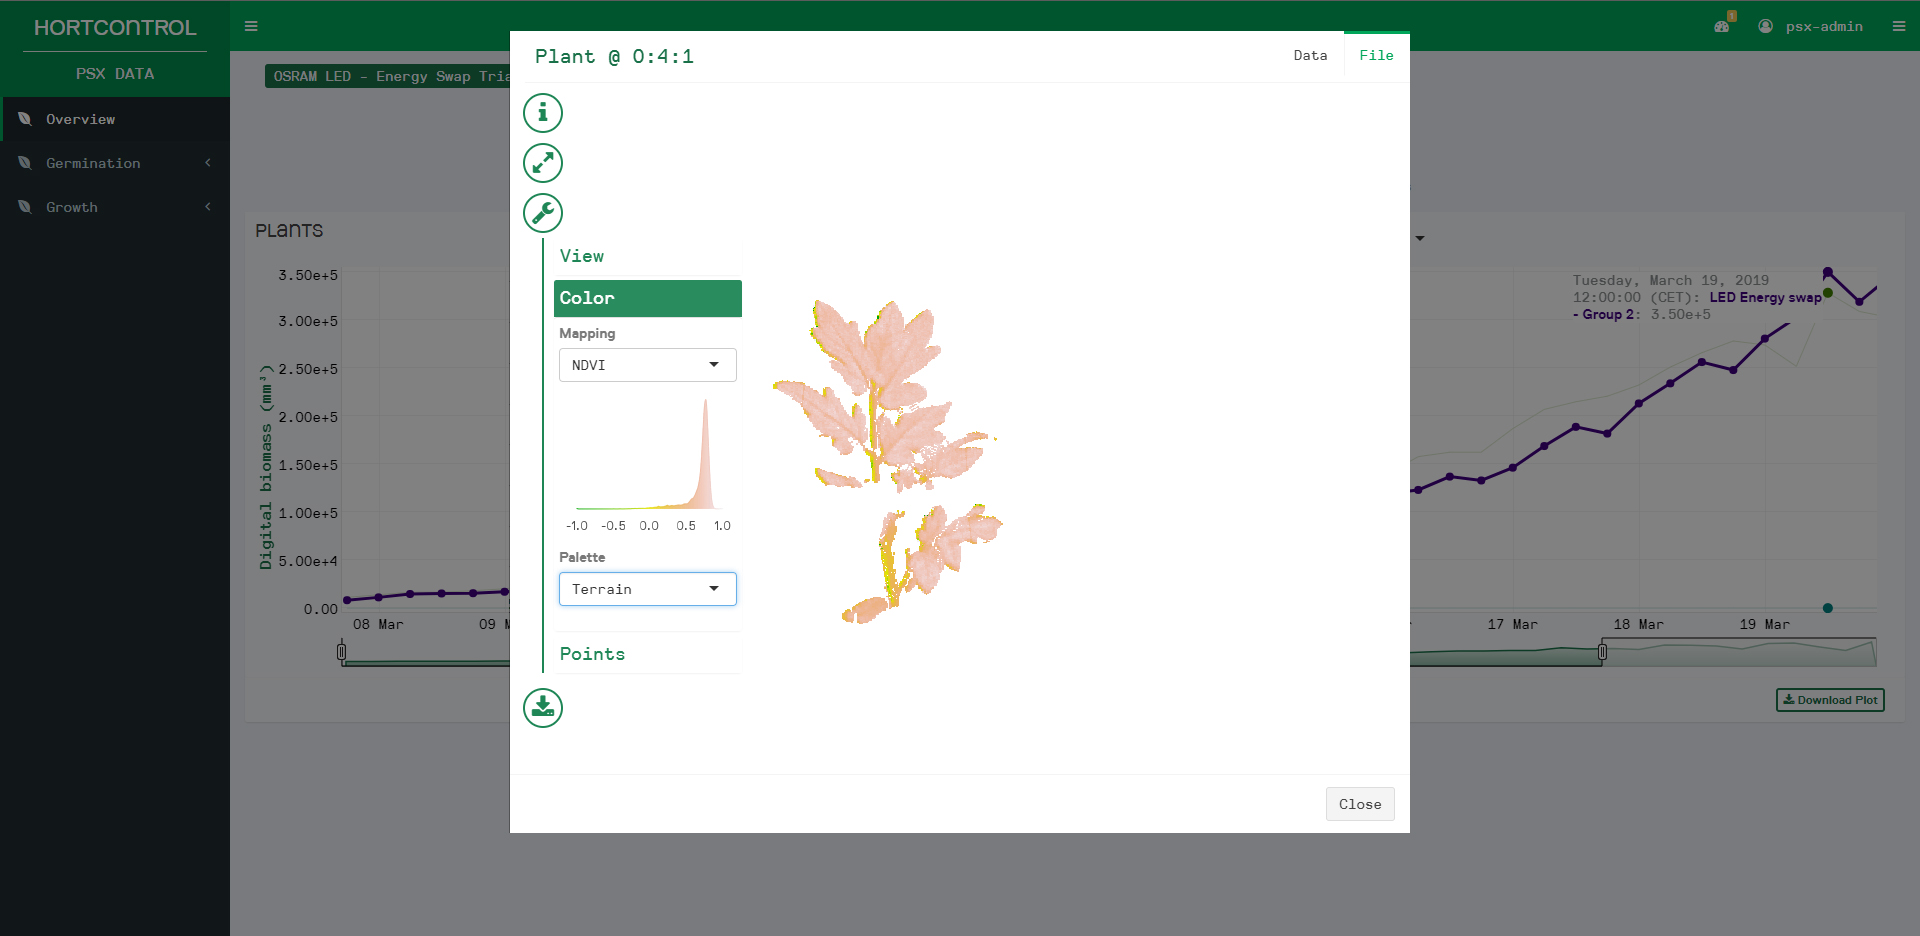
- Automated spectral data analysis
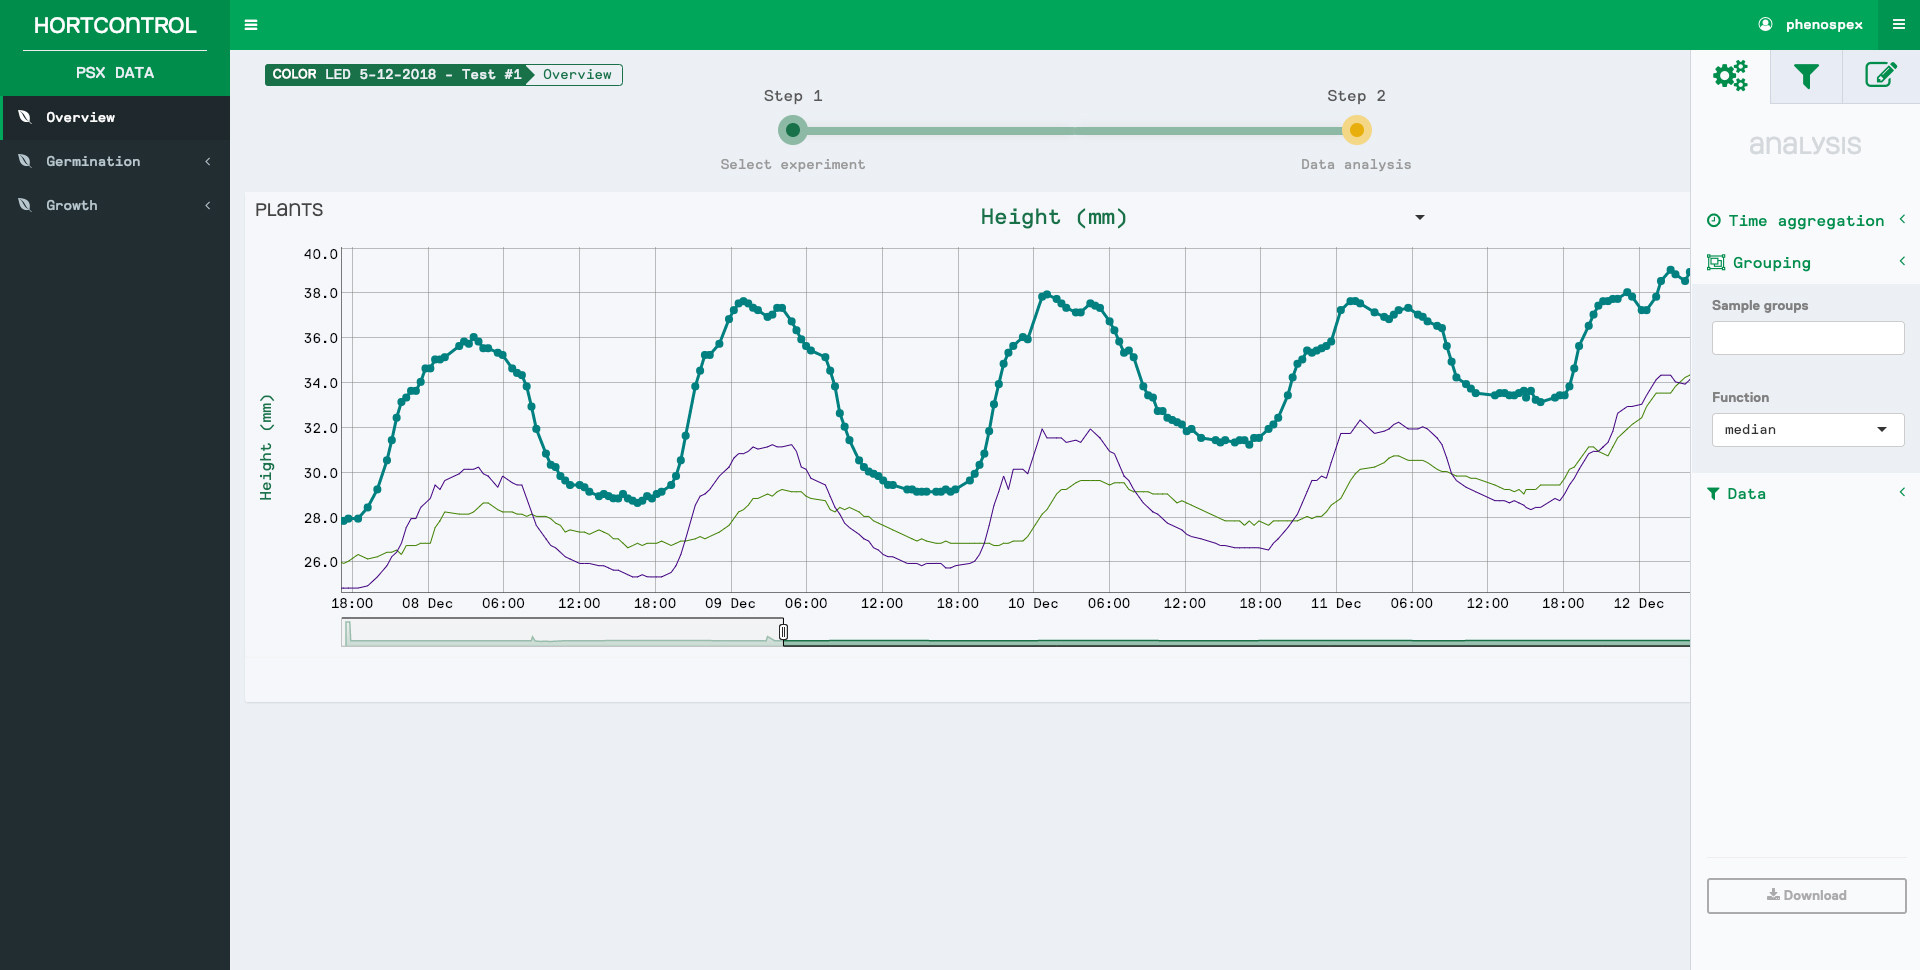
Growth dynamics (height in mm) visualized over time. Due to the high scan interval you can see clear day & night dynamics.
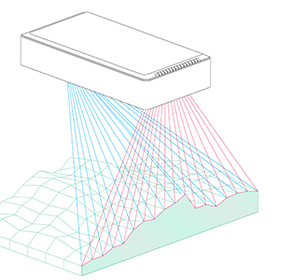
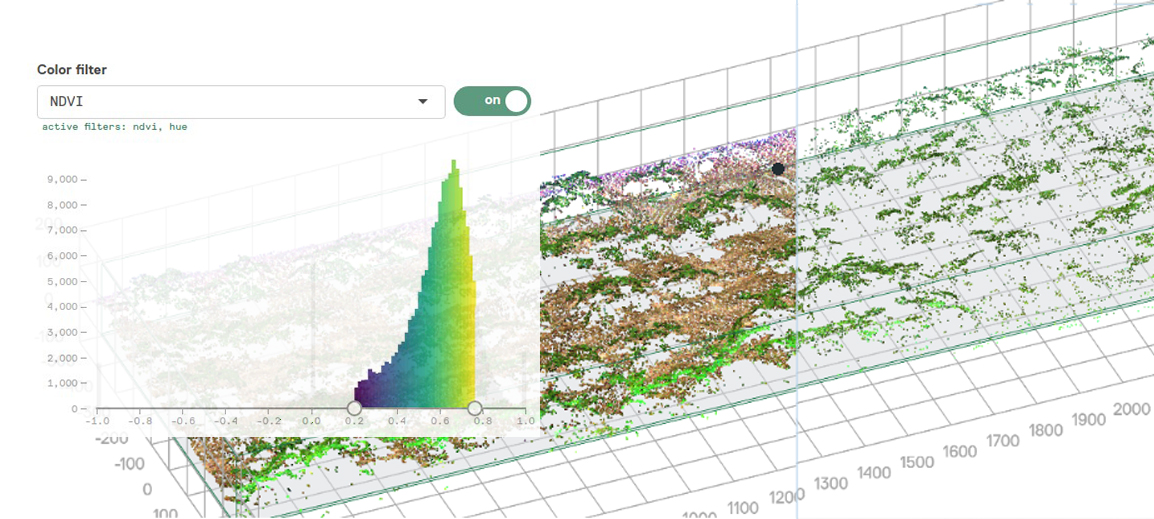
HortControl 3D NDVI visualization
All Sensor Data Centralized
Easily combine data from different sources
Combining data from multiple sensor providers is a complex and error-prone process. Gathering, aggregating, and filtering datasets from different platforms, while ensuring accurate meta information linkage, consumes significant time and resources.
All data coming from our sensors (PlantEye, DroughtSpotter & Weather Station) is centrally stored in HortControl. It shares a consistent format and includes essential meta information such as plant/plot ID, timestamps, genotype & treatment details. This standardized format allows for immediate analysis in any tool.
You can conveniently access the aggregated and filtered data through CSV downloads or automate data transfer using the HortControl API.

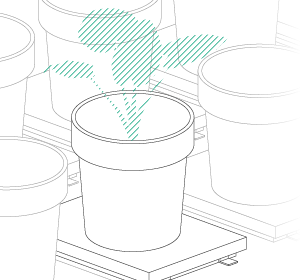
Assess water use efficiency (WUE)
Combine DroughtSpotter data with PlantEye’s 3D parameters Ilike leaf area or biomass to calculate parameters like water use efficiency.
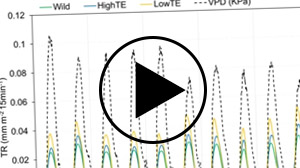
Screening genotypes for transpiration responses to VPD at Icrisat
Discover how Icrisat India accelerates the process of breeding drought-resistant and climate smart crops by combining 3D, gravimetric, and environmental data (paper). Watch the webinar here >
Plant Analysis tools
HortControl has great tools for data analysis applications that normally require a data scientist:
- Growth Analysis – box plots and quadrants
- Germination Assays – growth thresholds and mapping
- Correlation Module – Perform your validation studies entirely within HortControl
- Machine Learning Models – Create multivariate models to improve existing parameters
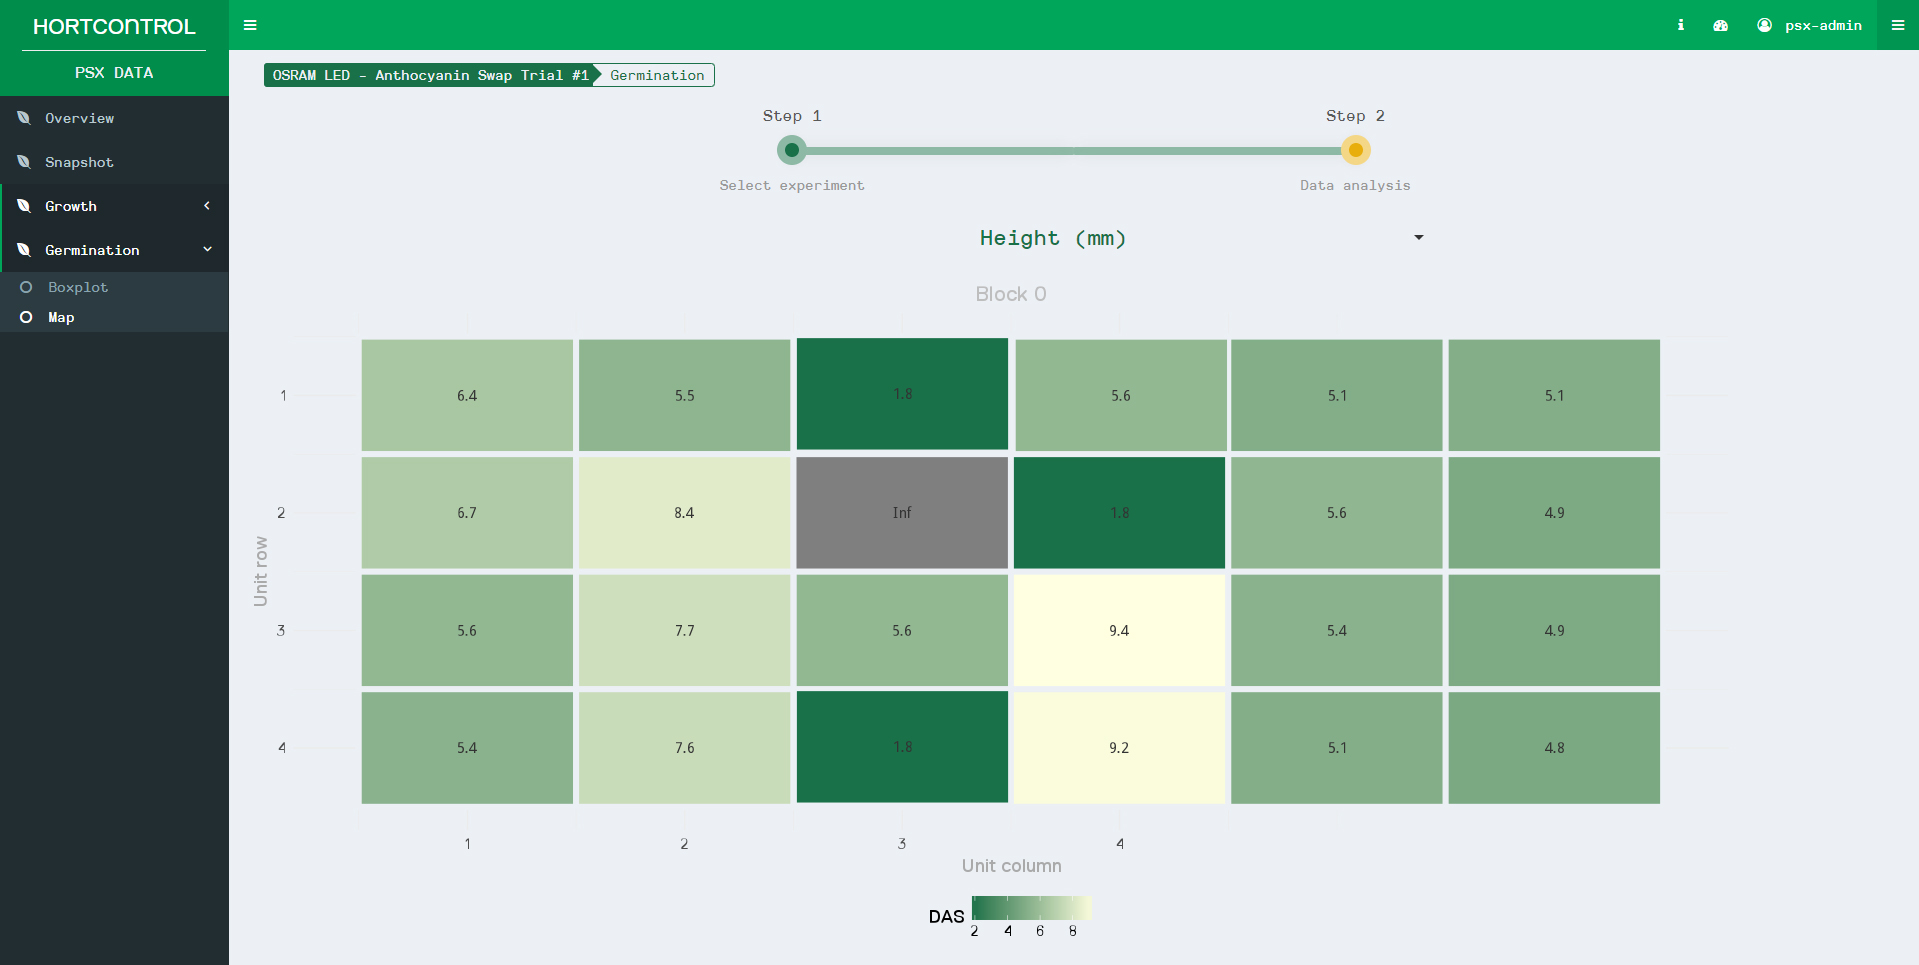
Germination Assay app – Showing days after sowing for each unit
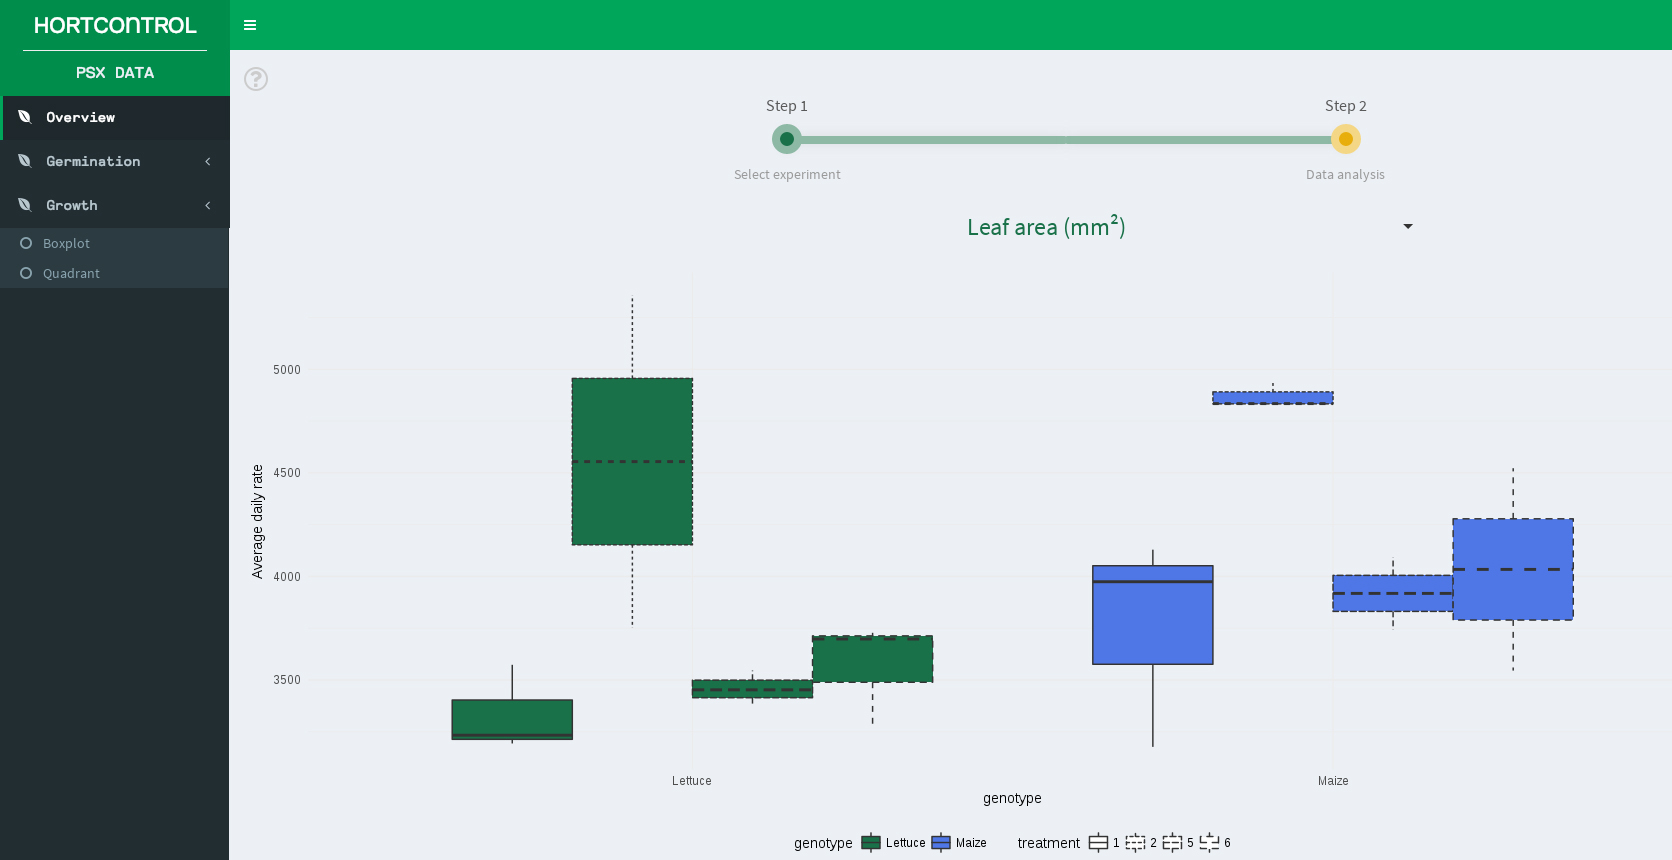
Create growth box plots, save the image and download the data.
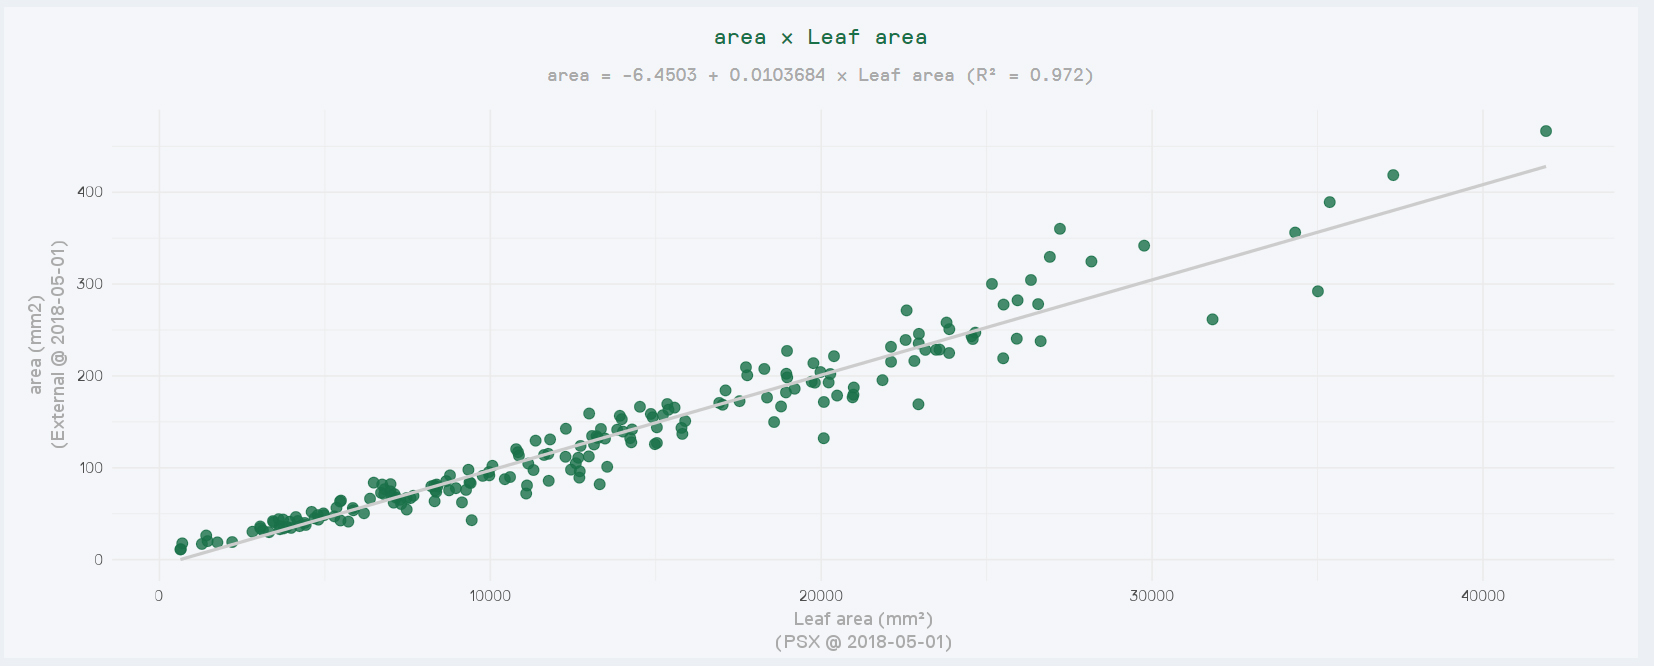
The correlation tool makes your validation studies easier
HortControl API
Automate the data transfer into any workflow
![]()
HortControl API is based on the industry standard BrAPI (breeding API). Automate the data transfer from HortControl into your workflow. No need any more to manually download the data on a routine basis and no more manual uploading to your analysis pipelines, machine learning models or anything else.
- Access & transfer plant parameter data and 3D files into any workflow
- interoperability between Phenospex data and other sources
- Compatible with data standards for plant phenotyping like MIAPPE
Why did we implement the Breeding API (BrAPI)? Read it here >
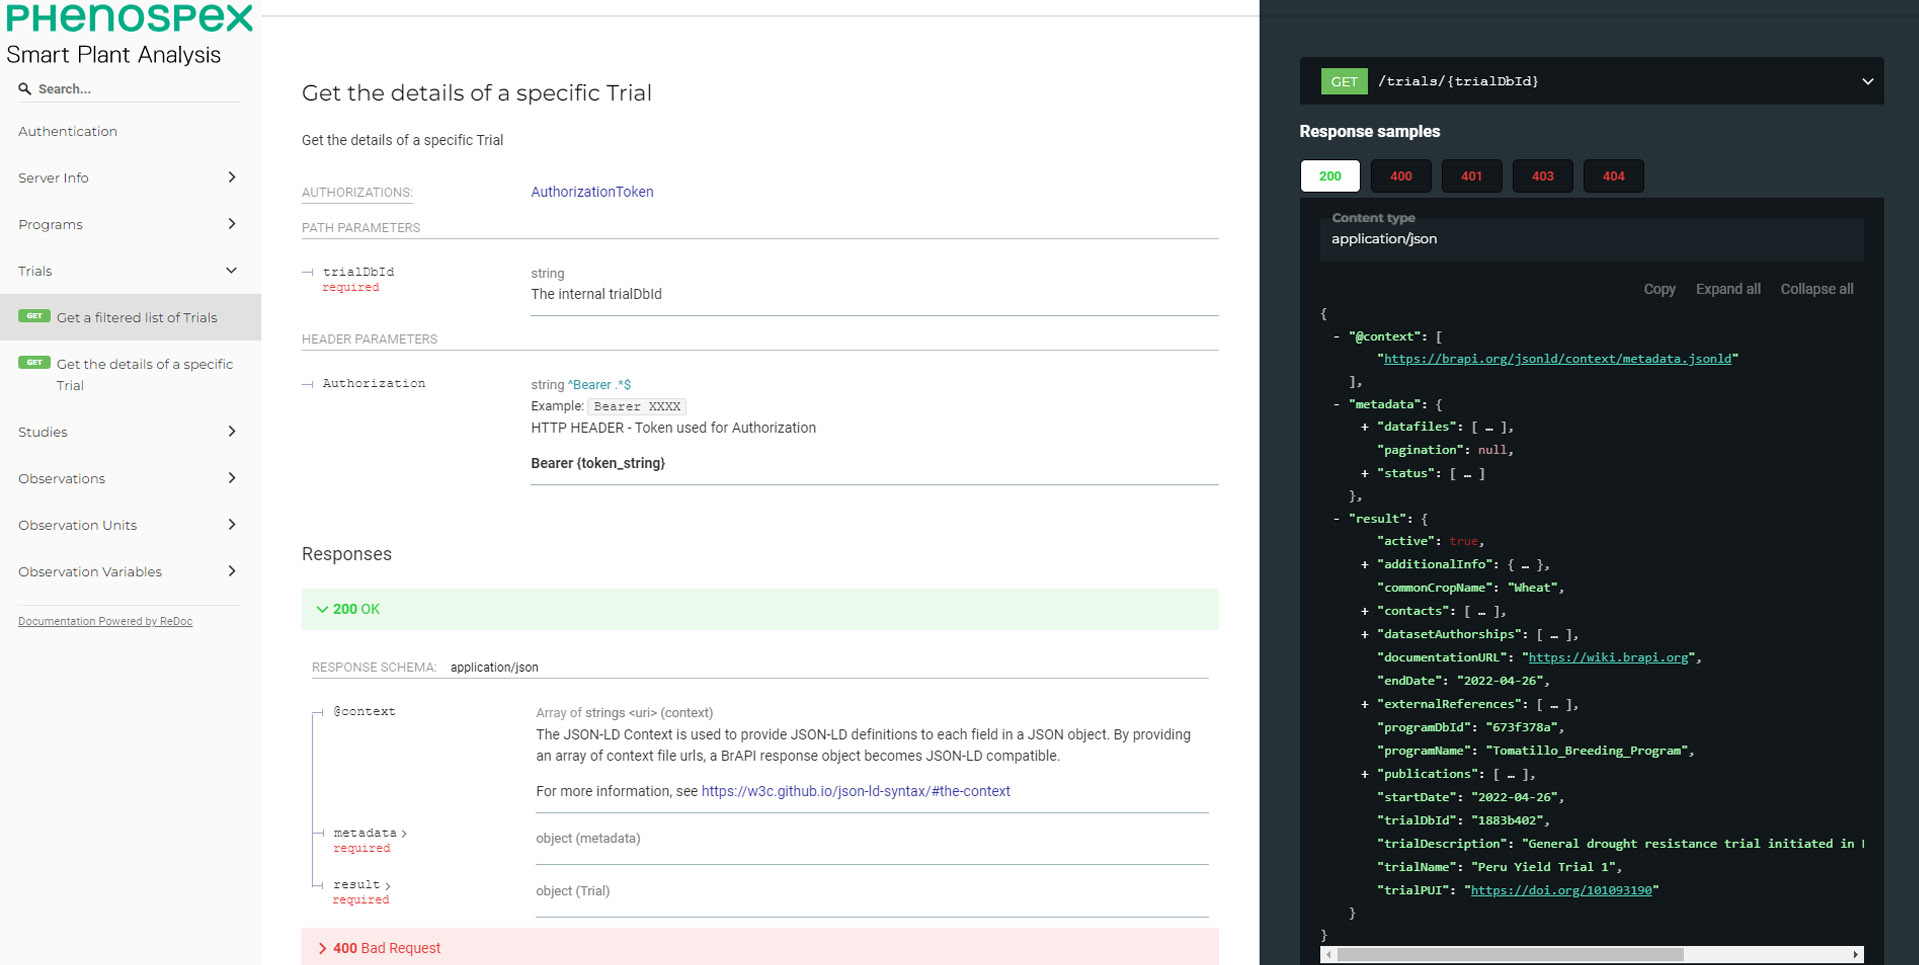
BrAPI documentation example
Consult or quote, contact us now!
Our experts explain the benefits of HortControl and ask questions to define your research needs. Just send us a message: