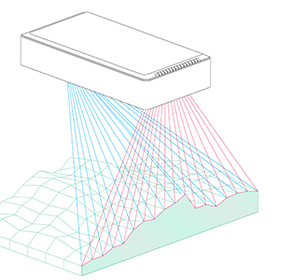

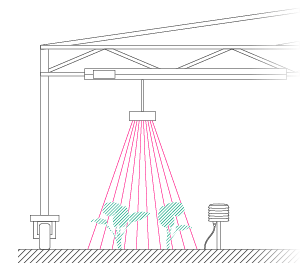
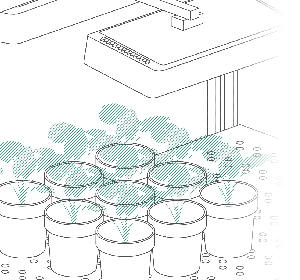

Optimizing Spectral Binning for PlantEye Products
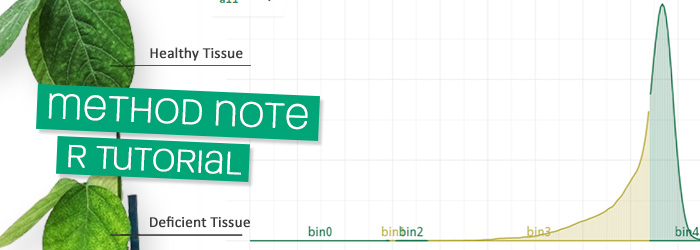
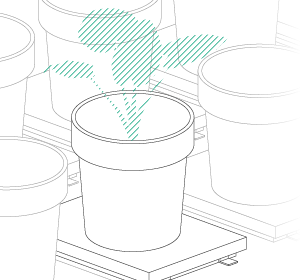
Are you looking to improve the accuracy of quantifying symptoms such as chlorosis, yellowing, or
Smart solutions for
digital phenotyping
During the training and consulting of our clients we noticed that some of our users are eager to dive deeper into.. Continue reading

Christoph Bremus
T: + 31 (0) 457 111 693
Write Email